Immigrants from Greece vs Immigrants from Romania 6th Grade
COMPARE
Immigrants from Greece
Immigrants from Romania
6th Grade
6th Grade Comparison
Immigrants from Greece
Immigrants from Romania
97.2%
6TH GRADE
77.8/ 100
METRIC RATING
148th/ 347
METRIC RANK
97.3%
6TH GRADE
92.0/ 100
METRIC RATING
128th/ 347
METRIC RANK
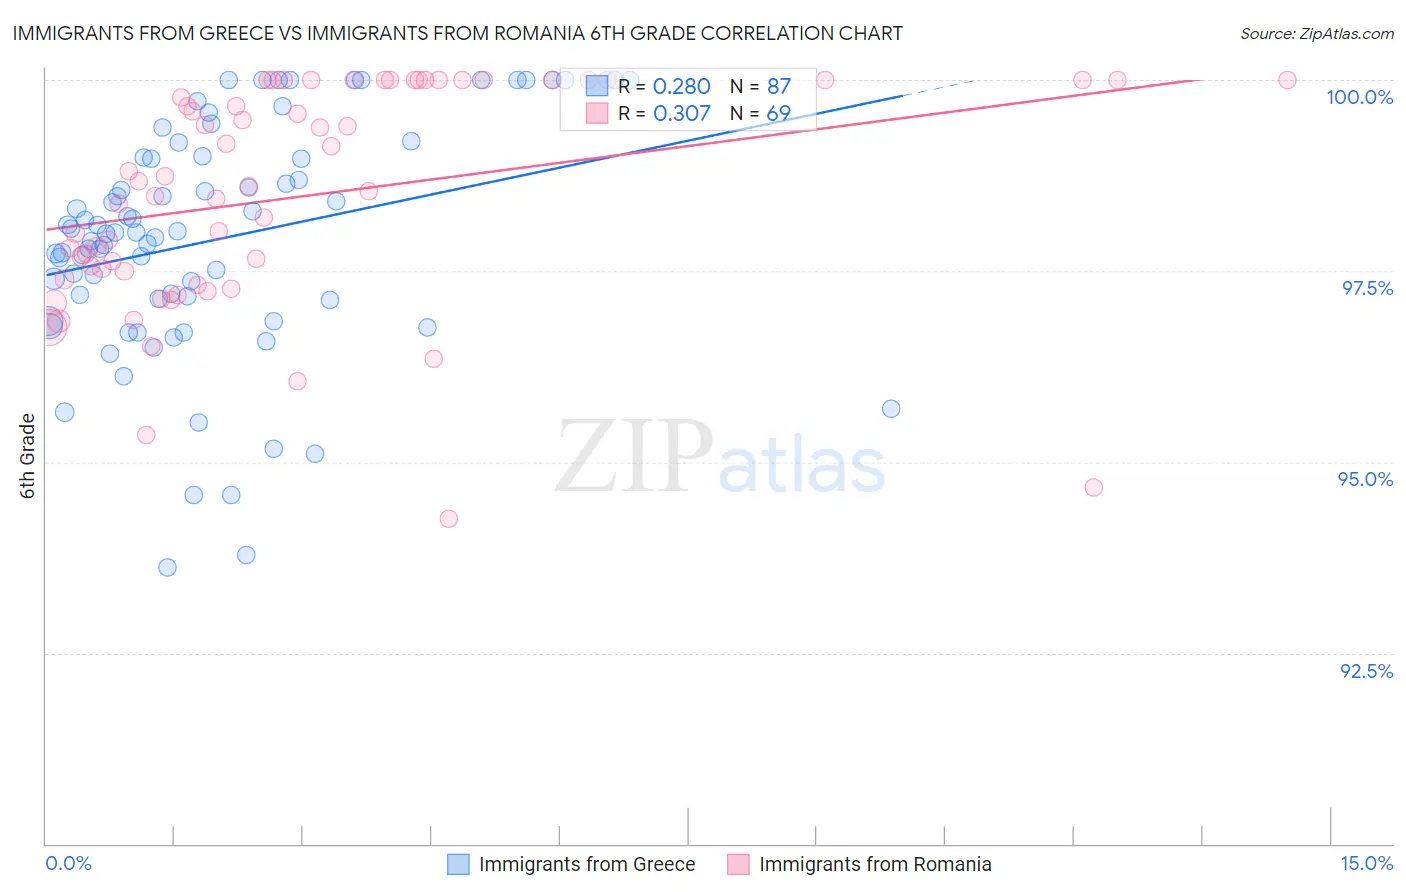
Immigrants from Greece vs Immigrants from Romania 6th Grade Correlation Chart
The statistical analysis conducted on geographies consisting of 216,879,847 people shows a weak positive correlation between the proportion of Immigrants from Greece and percentage of population with at least 6th grade education in the United States with a correlation coefficient (R) of 0.280 and weighted average of 97.2%. Similarly, the statistical analysis conducted on geographies consisting of 257,008,799 people shows a mild positive correlation between the proportion of Immigrants from Romania and percentage of population with at least 6th grade education in the United States with a correlation coefficient (R) of 0.307 and weighted average of 97.3%, a difference of 0.14%.
6th Grade Correlation Summary
| Measurement | Immigrants from Greece | Immigrants from Romania |
| Minimum | 93.6% | 94.3% |
| Maximum | 100.0% | 100.0% |
| Range | 6.4% | 5.7% |
| Mean | 97.9% | 98.5% |
| Median | 98.0% | 98.6% |
| Interquartile 25% (IQ1) | 97.1% | 97.4% |
| Interquartile 75% (IQ3) | 99.0% | 100.0% |
| Interquartile Range (IQR) | 1.9% | 2.6% |
| Standard Deviation (Sample) | 1.5% | 1.4% |
| Standard Deviation (Population) | 1.5% | 1.4% |
Demographics Similar to Immigrants from Greece and Immigrants from Romania by 6th Grade
In terms of 6th grade, the demographic groups most similar to Immigrants from Greece are Immigrants from South Central Asia (97.2%, a difference of 0.0%), Hopi (97.2%, a difference of 0.010%), Spaniard (97.2%, a difference of 0.020%), Pima (97.2%, a difference of 0.040%), and Israeli (97.2%, a difference of 0.040%). Similarly, the demographic groups most similar to Immigrants from Romania are Immigrants from Serbia (97.3%, a difference of 0.0%), Cambodian (97.3%, a difference of 0.0%), Immigrants from Europe (97.3%, a difference of 0.010%), Palestinian (97.3%, a difference of 0.020%), and Immigrants from Moldova (97.3%, a difference of 0.030%).
| Demographics | Rating | Rank | 6th Grade |
| Immigrants | Romania | 92.0 /100 | #128 | Exceptional 97.3% |
| Immigrants | Serbia | 91.9 /100 | #129 | Exceptional 97.3% |
| Cambodians | 91.8 /100 | #130 | Exceptional 97.3% |
| Immigrants | Europe | 91.1 /100 | #131 | Exceptional 97.3% |
| Palestinians | 90.9 /100 | #132 | Exceptional 97.3% |
| Immigrants | Moldova | 90.0 /100 | #133 | Excellent 97.3% |
| Immigrants | Kuwait | 89.5 /100 | #134 | Excellent 97.3% |
| Immigrants | Hungary | 89.5 /100 | #135 | Excellent 97.3% |
| Filipinos | 88.9 /100 | #136 | Excellent 97.3% |
| Burmese | 87.8 /100 | #137 | Excellent 97.3% |
| Blackfeet | 87.7 /100 | #138 | Excellent 97.3% |
| Immigrants | Turkey | 86.1 /100 | #139 | Excellent 97.3% |
| Immigrants | North Macedonia | 85.5 /100 | #140 | Excellent 97.2% |
| Seminole | 84.8 /100 | #141 | Excellent 97.2% |
| Jordanians | 84.6 /100 | #142 | Excellent 97.2% |
| Pima | 82.9 /100 | #143 | Excellent 97.2% |
| Israelis | 82.9 /100 | #144 | Excellent 97.2% |
| Spaniards | 80.1 /100 | #145 | Excellent 97.2% |
| Hopi | 78.8 /100 | #146 | Good 97.2% |
| Immigrants | South Central Asia | 78.1 /100 | #147 | Good 97.2% |
| Immigrants | Greece | 77.8 /100 | #148 | Good 97.2% |