Apache vs Immigrants from Romania 6th Grade
COMPARE
Apache
Immigrants from Romania
6th Grade
6th Grade Comparison
Apache
Immigrants from Romania
97.1%
6TH GRADE
53.6/ 100
METRIC RATING
167th/ 347
METRIC RANK
97.3%
6TH GRADE
92.0/ 100
METRIC RATING
128th/ 347
METRIC RANK
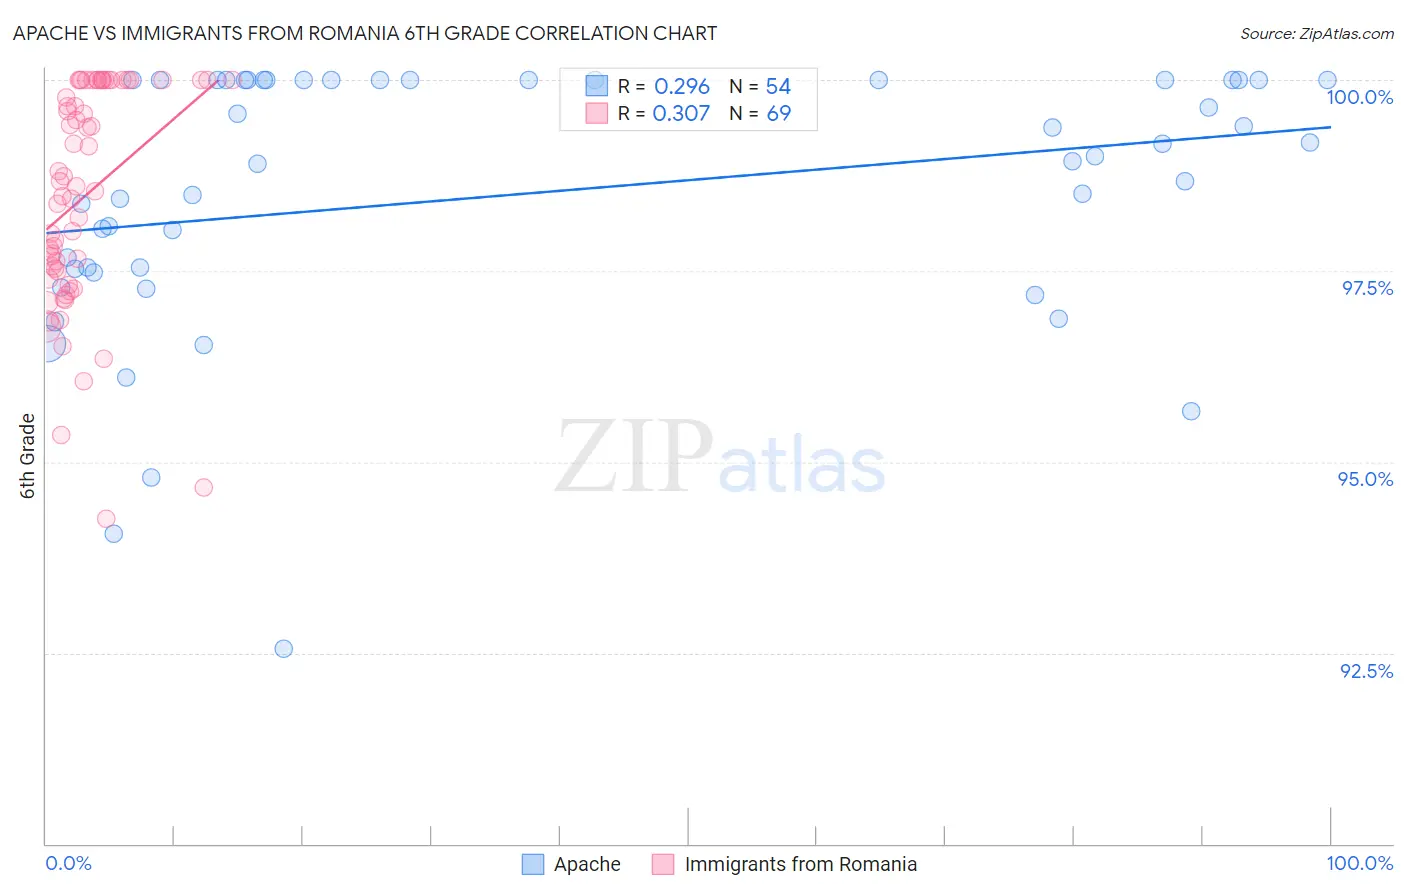
Apache vs Immigrants from Romania 6th Grade Correlation Chart
The statistical analysis conducted on geographies consisting of 231,142,814 people shows a weak positive correlation between the proportion of Apache and percentage of population with at least 6th grade education in the United States with a correlation coefficient (R) of 0.296 and weighted average of 97.1%. Similarly, the statistical analysis conducted on geographies consisting of 257,008,799 people shows a mild positive correlation between the proportion of Immigrants from Romania and percentage of population with at least 6th grade education in the United States with a correlation coefficient (R) of 0.307 and weighted average of 97.3%, a difference of 0.26%.
6th Grade Correlation Summary
| Measurement | Apache | Immigrants from Romania |
| Minimum | 92.5% | 94.3% |
| Maximum | 100.0% | 100.0% |
| Range | 7.5% | 5.7% |
| Mean | 98.5% | 98.5% |
| Median | 99.0% | 98.6% |
| Interquartile 25% (IQ1) | 97.5% | 97.4% |
| Interquartile 75% (IQ3) | 100.0% | 100.0% |
| Interquartile Range (IQR) | 2.5% | 2.6% |
| Standard Deviation (Sample) | 1.7% | 1.4% |
| Standard Deviation (Population) | 1.7% | 1.4% |
Similar Demographics by 6th Grade
Demographics Similar to Apache by 6th Grade
In terms of 6th grade, the demographic groups most similar to Apache are Immigrants from Italy (97.1%, a difference of 0.0%), Immigrants from Taiwan (97.1%, a difference of 0.0%), Bermudan (97.1%, a difference of 0.0%), Immigrants from Poland (97.1%, a difference of 0.010%), and Chilean (97.1%, a difference of 0.010%).
| Demographics | Rating | Rank | 6th Grade |
| Ugandans | 62.2 /100 | #160 | Good 97.1% |
| Immigrants | Belarus | 60.4 /100 | #161 | Good 97.1% |
| Marshallese | 60.2 /100 | #162 | Good 97.1% |
| Albanians | 57.8 /100 | #163 | Average 97.1% |
| Immigrants | Korea | 57.7 /100 | #164 | Average 97.1% |
| Immigrants | Poland | 56.2 /100 | #165 | Average 97.1% |
| Immigrants | Italy | 53.8 /100 | #166 | Average 97.1% |
| Apache | 53.6 /100 | #167 | Average 97.1% |
| Immigrants | Taiwan | 53.5 /100 | #168 | Average 97.1% |
| Bermudans | 52.6 /100 | #169 | Average 97.1% |
| Chileans | 52.1 /100 | #170 | Average 97.1% |
| Immigrants | Sri Lanka | 51.7 /100 | #171 | Average 97.1% |
| Egyptians | 50.9 /100 | #172 | Average 97.1% |
| Arabs | 50.1 /100 | #173 | Average 97.0% |
| Venezuelans | 50.0 /100 | #174 | Average 97.0% |
Demographics Similar to Immigrants from Romania by 6th Grade
In terms of 6th grade, the demographic groups most similar to Immigrants from Romania are Immigrants from Serbia (97.3%, a difference of 0.0%), Cambodian (97.3%, a difference of 0.0%), Immigrants from Europe (97.3%, a difference of 0.010%), Immigrants from Croatia (97.3%, a difference of 0.020%), and Palestinian (97.3%, a difference of 0.020%).
| Demographics | Rating | Rank | 6th Grade |
| Immigrants | Norway | 94.7 /100 | #121 | Exceptional 97.4% |
| Immigrants | France | 94.5 /100 | #122 | Exceptional 97.4% |
| Hmong | 94.4 /100 | #123 | Exceptional 97.4% |
| Okinawans | 94.2 /100 | #124 | Exceptional 97.4% |
| Spanish | 93.7 /100 | #125 | Exceptional 97.3% |
| Immigrants | Bulgaria | 93.6 /100 | #126 | Exceptional 97.3% |
| Immigrants | Croatia | 93.1 /100 | #127 | Exceptional 97.3% |
| Immigrants | Romania | 92.0 /100 | #128 | Exceptional 97.3% |
| Immigrants | Serbia | 91.9 /100 | #129 | Exceptional 97.3% |
| Cambodians | 91.8 /100 | #130 | Exceptional 97.3% |
| Immigrants | Europe | 91.1 /100 | #131 | Exceptional 97.3% |
| Palestinians | 90.9 /100 | #132 | Exceptional 97.3% |
| Immigrants | Moldova | 90.0 /100 | #133 | Excellent 97.3% |
| Immigrants | Kuwait | 89.5 /100 | #134 | Excellent 97.3% |
| Immigrants | Hungary | 89.5 /100 | #135 | Excellent 97.3% |