Soviet Union vs Nicaraguan 6th Grade
COMPARE
Soviet Union
Nicaraguan
6th Grade
6th Grade Comparison
Soviet Union
Nicaraguans
97.2%
6TH GRADE
71.5/ 100
METRIC RATING
154th/ 347
METRIC RANK
95.4%
6TH GRADE
0.0/ 100
METRIC RATING
313th/ 347
METRIC RANK
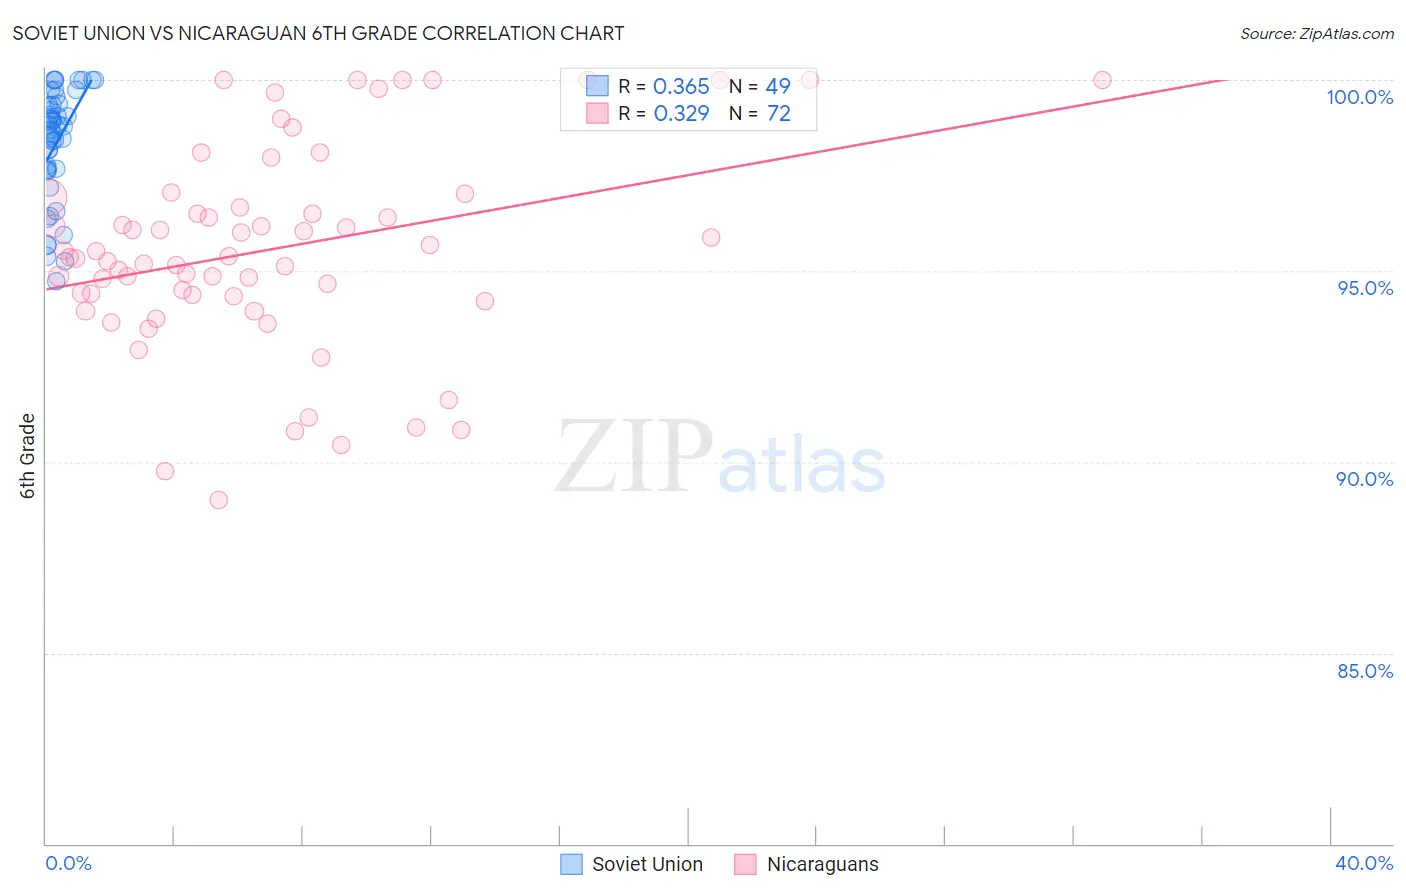
Soviet Union vs Nicaraguan 6th Grade Correlation Chart
The statistical analysis conducted on geographies consisting of 43,454,395 people shows a mild positive correlation between the proportion of Soviet Union and percentage of population with at least 6th grade education in the United States with a correlation coefficient (R) of 0.365 and weighted average of 97.2%. Similarly, the statistical analysis conducted on geographies consisting of 285,711,389 people shows a mild positive correlation between the proportion of Nicaraguans and percentage of population with at least 6th grade education in the United States with a correlation coefficient (R) of 0.329 and weighted average of 95.4%, a difference of 1.8%.
6th Grade Correlation Summary
| Measurement | Soviet Union | Nicaraguan |
| Minimum | 94.7% | 89.0% |
| Maximum | 100.0% | 100.0% |
| Range | 5.3% | 11.0% |
| Mean | 98.3% | 95.6% |
| Median | 98.8% | 95.4% |
| Interquartile 25% (IQ1) | 97.7% | 94.4% |
| Interquartile 75% (IQ3) | 99.4% | 96.8% |
| Interquartile Range (IQR) | 1.7% | 2.4% |
| Standard Deviation (Sample) | 1.4% | 2.7% |
| Standard Deviation (Population) | 1.4% | 2.6% |
Similar Demographics by 6th Grade
Demographics Similar to Soviet Union by 6th Grade
In terms of 6th grade, the demographic groups most similar to Soviet Union are Ute (97.1%, a difference of 0.0%), French American Indian (97.2%, a difference of 0.010%), Immigrants from Jordan (97.2%, a difference of 0.010%), Immigrants from Eastern Europe (97.2%, a difference of 0.010%), and Alsatian (97.1%, a difference of 0.010%).
| Demographics | Rating | Rank | 6th Grade |
| Immigrants | South Central Asia | 78.1 /100 | #147 | Good 97.2% |
| Immigrants | Greece | 77.8 /100 | #148 | Good 97.2% |
| Immigrants | Israel | 76.0 /100 | #149 | Good 97.2% |
| Immigrants | Bosnia and Herzegovina | 74.8 /100 | #150 | Good 97.2% |
| French American Indians | 74.0 /100 | #151 | Good 97.2% |
| Immigrants | Jordan | 73.0 /100 | #152 | Good 97.2% |
| Immigrants | Eastern Europe | 72.6 /100 | #153 | Good 97.2% |
| Soviet Union | 71.5 /100 | #154 | Good 97.2% |
| Ute | 71.1 /100 | #155 | Good 97.1% |
| Alsatians | 69.8 /100 | #156 | Good 97.1% |
| Immigrants | Russia | 67.6 /100 | #157 | Good 97.1% |
| Immigrants | Iran | 63.3 /100 | #158 | Good 97.1% |
| Kenyans | 62.9 /100 | #159 | Good 97.1% |
| Ugandans | 62.2 /100 | #160 | Good 97.1% |
| Immigrants | Belarus | 60.4 /100 | #161 | Good 97.1% |
Demographics Similar to Nicaraguans by 6th Grade
In terms of 6th grade, the demographic groups most similar to Nicaraguans are Immigrants from Vietnam (95.4%, a difference of 0.010%), Immigrants from Bangladesh (95.4%, a difference of 0.020%), Japanese (95.4%, a difference of 0.030%), Vietnamese (95.3%, a difference of 0.060%), and Belizean (95.3%, a difference of 0.080%).
| Demographics | Rating | Rank | 6th Grade |
| Immigrants | Haiti | 0.0 /100 | #306 | Tragic 95.6% |
| Guyanese | 0.0 /100 | #307 | Tragic 95.6% |
| Immigrants | Caribbean | 0.0 /100 | #308 | Tragic 95.6% |
| Puerto Ricans | 0.0 /100 | #309 | Tragic 95.5% |
| Ecuadorians | 0.0 /100 | #310 | Tragic 95.5% |
| Immigrants | Portugal | 0.0 /100 | #311 | Tragic 95.5% |
| Immigrants | Guyana | 0.0 /100 | #312 | Tragic 95.5% |
| Nicaraguans | 0.0 /100 | #313 | Tragic 95.4% |
| Immigrants | Vietnam | 0.0 /100 | #314 | Tragic 95.4% |
| Immigrants | Bangladesh | 0.0 /100 | #315 | Tragic 95.4% |
| Japanese | 0.0 /100 | #316 | Tragic 95.4% |
| Vietnamese | 0.0 /100 | #317 | Tragic 95.3% |
| Belizeans | 0.0 /100 | #318 | Tragic 95.3% |
| Immigrants | Belize | 0.0 /100 | #319 | Tragic 95.3% |
| Immigrants | Ecuador | 0.0 /100 | #320 | Tragic 95.3% |