Immigrants from England vs Immigrants from Africa Nursery School
COMPARE
Immigrants from England
Immigrants from Africa
Nursery School
Nursery School Comparison
Immigrants from England
Immigrants from Africa
98.3%
NURSERY SCHOOL
99.3/ 100
METRIC RATING
76th/ 347
METRIC RANK
97.6%
NURSERY SCHOOL
0.8/ 100
METRIC RATING
252nd/ 347
METRIC RANK
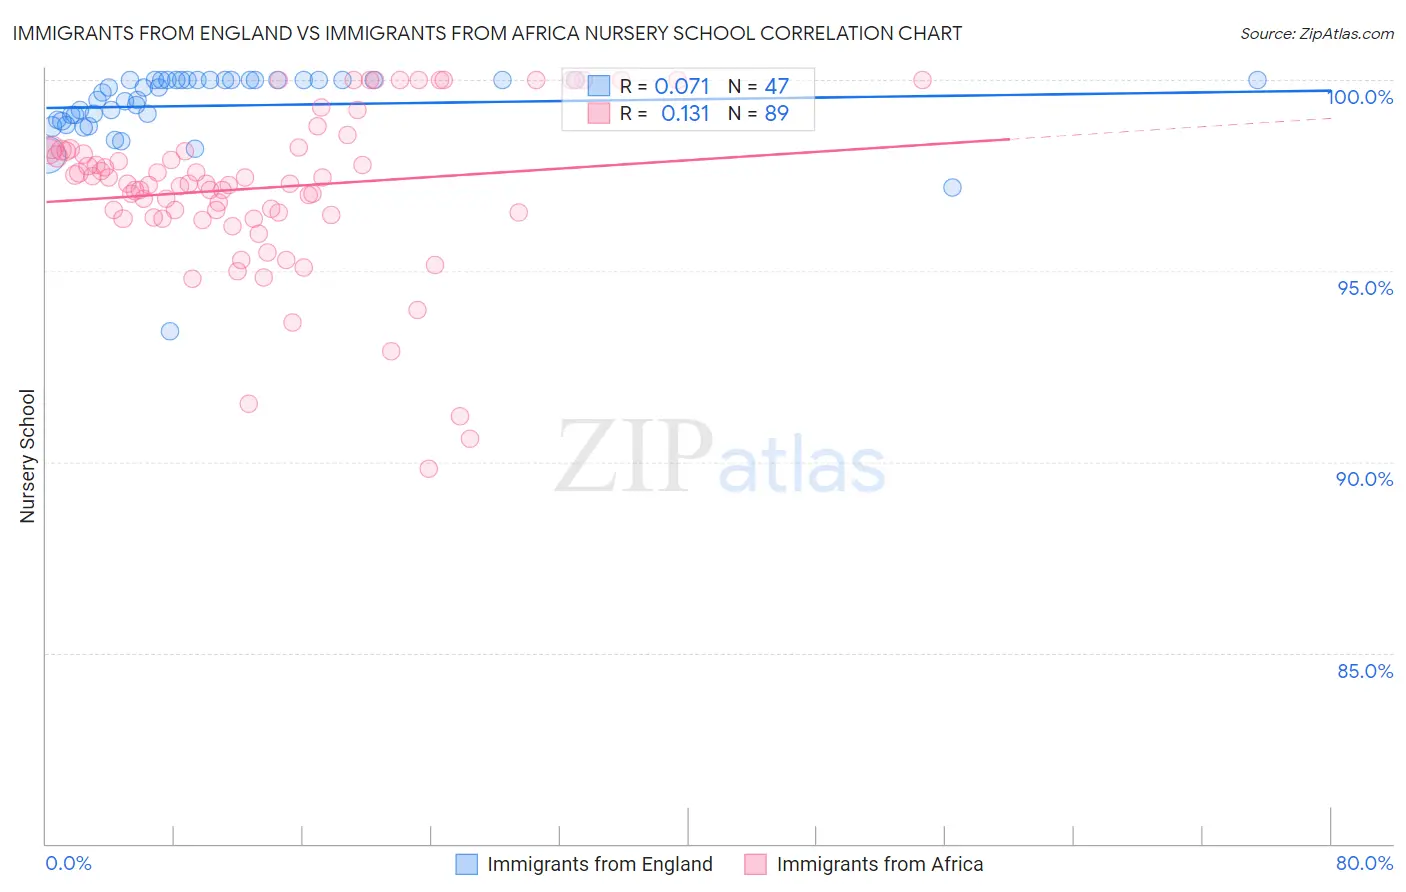
Immigrants from England vs Immigrants from Africa Nursery School Correlation Chart
The statistical analysis conducted on geographies consisting of 391,898,018 people shows a slight positive correlation between the proportion of Immigrants from England and percentage of population with at least nursery school education in the United States with a correlation coefficient (R) of 0.071 and weighted average of 98.3%. Similarly, the statistical analysis conducted on geographies consisting of 469,440,174 people shows a poor positive correlation between the proportion of Immigrants from Africa and percentage of population with at least nursery school education in the United States with a correlation coefficient (R) of 0.131 and weighted average of 97.6%, a difference of 0.74%.
Nursery School Correlation Summary
| Measurement | Immigrants from England | Immigrants from Africa |
| Minimum | 93.4% | 89.8% |
| Maximum | 100.0% | 100.0% |
| Range | 6.6% | 10.2% |
| Mean | 99.3% | 97.2% |
| Median | 99.8% | 97.3% |
| Interquartile 25% (IQ1) | 98.9% | 96.4% |
| Interquartile 75% (IQ3) | 100.0% | 98.2% |
| Interquartile Range (IQR) | 1.1% | 1.7% |
| Standard Deviation (Sample) | 1.1% | 2.1% |
| Standard Deviation (Population) | 1.1% | 2.1% |
Similar Demographics by Nursery School
Demographics Similar to Immigrants from England by Nursery School
In terms of nursery school, the demographic groups most similar to Immigrants from England are Cherokee (98.3%, a difference of 0.0%), Immigrants from Lithuania (98.3%, a difference of 0.0%), Delaware (98.3%, a difference of 0.0%), Immigrants from Belgium (98.3%, a difference of 0.0%), and Cajun (98.4%, a difference of 0.010%).
| Demographics | Rating | Rank | Nursery School |
| Immigrants | Austria | 99.6 /100 | #69 | Exceptional 98.4% |
| Cheyenne | 99.6 /100 | #70 | Exceptional 98.4% |
| Serbians | 99.6 /100 | #71 | Exceptional 98.4% |
| Chickasaw | 99.6 /100 | #72 | Exceptional 98.4% |
| Cajuns | 99.4 /100 | #73 | Exceptional 98.4% |
| Immigrants | Netherlands | 99.4 /100 | #74 | Exceptional 98.4% |
| Cherokee | 99.3 /100 | #75 | Exceptional 98.3% |
| Immigrants | England | 99.3 /100 | #76 | Exceptional 98.3% |
| Immigrants | Lithuania | 99.3 /100 | #77 | Exceptional 98.3% |
| Delaware | 99.3 /100 | #78 | Exceptional 98.3% |
| Immigrants | Belgium | 99.3 /100 | #79 | Exceptional 98.3% |
| Shoshone | 99.3 /100 | #80 | Exceptional 98.3% |
| Icelanders | 99.2 /100 | #81 | Exceptional 98.3% |
| Potawatomi | 99.2 /100 | #82 | Exceptional 98.3% |
| Osage | 99.1 /100 | #83 | Exceptional 98.3% |
Demographics Similar to Immigrants from Africa by Nursery School
In terms of nursery school, the demographic groups most similar to Immigrants from Africa are Ethiopian (97.6%, a difference of 0.0%), Immigrants from Iraq (97.6%, a difference of 0.0%), Immigrants from Eastern Africa (97.6%, a difference of 0.010%), Immigrants from Senegal (97.6%, a difference of 0.010%), and Immigrants from Congo (97.6%, a difference of 0.010%).
| Demographics | Rating | Rank | Nursery School |
| Bolivians | 1.0 /100 | #245 | Tragic 97.6% |
| Peruvians | 1.0 /100 | #246 | Tragic 97.6% |
| Immigrants | Middle Africa | 0.9 /100 | #247 | Tragic 97.6% |
| Indians (Asian) | 0.9 /100 | #248 | Tragic 97.6% |
| Immigrants | Eastern Africa | 0.9 /100 | #249 | Tragic 97.6% |
| Immigrants | Senegal | 0.9 /100 | #250 | Tragic 97.6% |
| Ethiopians | 0.8 /100 | #251 | Tragic 97.6% |
| Immigrants | Africa | 0.8 /100 | #252 | Tragic 97.6% |
| Immigrants | Iraq | 0.7 /100 | #253 | Tragic 97.6% |
| Immigrants | Congo | 0.7 /100 | #254 | Tragic 97.6% |
| Immigrants | Asia | 0.7 /100 | #255 | Tragic 97.6% |
| Yaqui | 0.6 /100 | #256 | Tragic 97.6% |
| Immigrants | Colombia | 0.6 /100 | #257 | Tragic 97.6% |
| Jamaicans | 0.6 /100 | #258 | Tragic 97.6% |
| Armenians | 0.4 /100 | #259 | Tragic 97.6% |