South American Indian vs Yugoslavian 10th Grade
COMPARE
South American Indian
Yugoslavian
10th Grade
10th Grade Comparison
South American Indians
Yugoslavians
93.1%
10TH GRADE
4.9/ 100
METRIC RATING
231st/ 347
METRIC RANK
94.6%
10TH GRADE
98.4/ 100
METRIC RATING
92nd/ 347
METRIC RANK
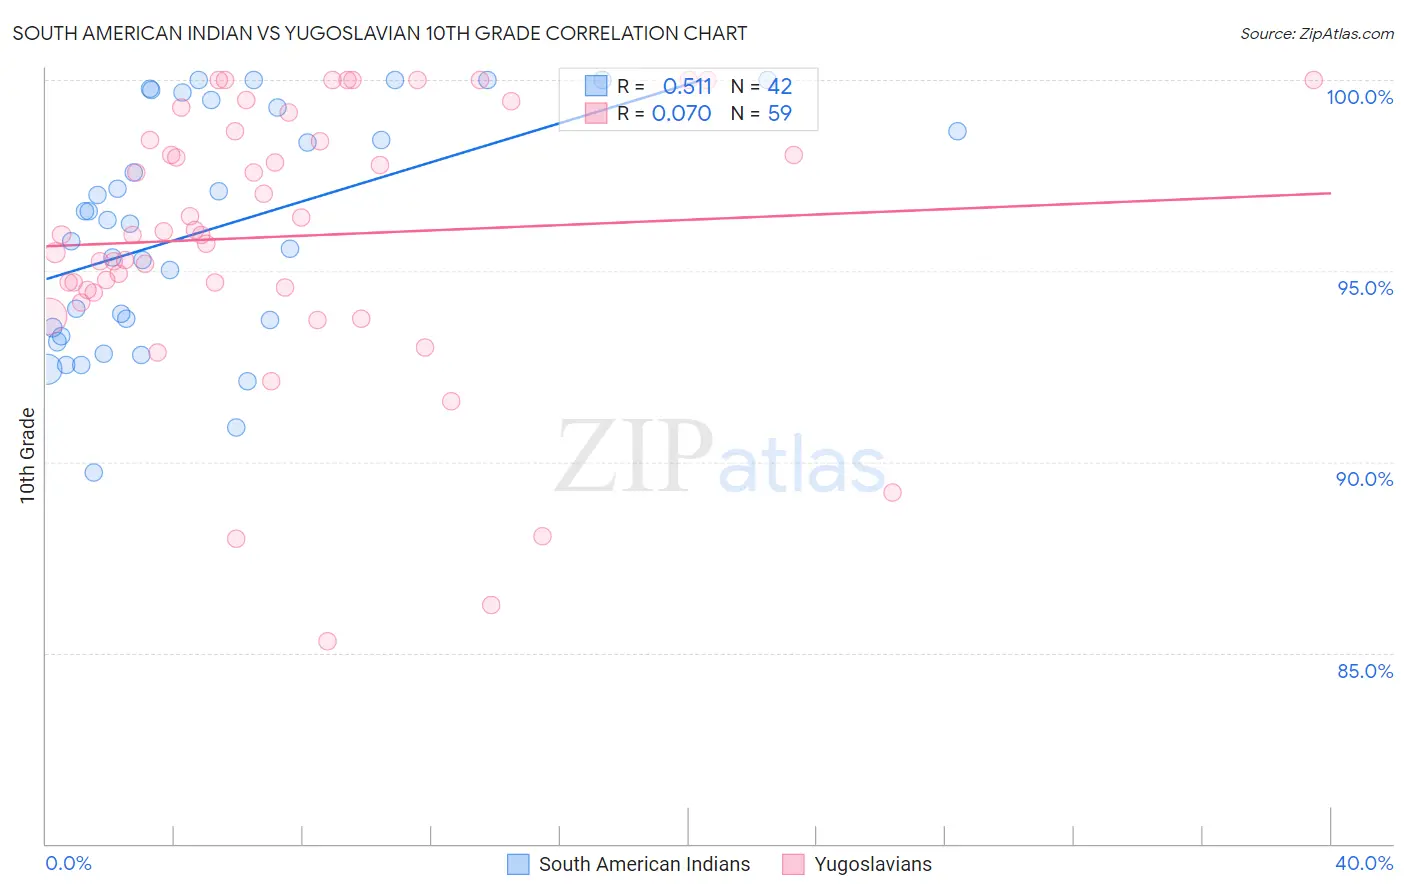
South American Indian vs Yugoslavian 10th Grade Correlation Chart
The statistical analysis conducted on geographies consisting of 164,571,317 people shows a substantial positive correlation between the proportion of South American Indians and percentage of population with at least 10th grade education in the United States with a correlation coefficient (R) of 0.511 and weighted average of 93.1%. Similarly, the statistical analysis conducted on geographies consisting of 285,719,638 people shows a slight positive correlation between the proportion of Yugoslavians and percentage of population with at least 10th grade education in the United States with a correlation coefficient (R) of 0.070 and weighted average of 94.6%, a difference of 1.6%.
10th Grade Correlation Summary
| Measurement | South American Indian | Yugoslavian |
| Minimum | 89.7% | 85.3% |
| Maximum | 100.0% | 100.0% |
| Range | 10.3% | 14.7% |
| Mean | 96.1% | 95.9% |
| Median | 96.3% | 95.9% |
| Interquartile 25% (IQ1) | 93.5% | 94.5% |
| Interquartile 75% (IQ3) | 99.3% | 98.7% |
| Interquartile Range (IQR) | 5.8% | 4.1% |
| Standard Deviation (Sample) | 3.0% | 3.5% |
| Standard Deviation (Population) | 2.9% | 3.5% |
Similar Demographics by 10th Grade
Demographics Similar to South American Indians by 10th Grade
In terms of 10th grade, the demographic groups most similar to South American Indians are Bahamian (93.1%, a difference of 0.0%), Comanche (93.1%, a difference of 0.0%), Immigrants from Ethiopia (93.1%, a difference of 0.010%), Immigrants from Africa (93.1%, a difference of 0.010%), and Subsaharan African (93.1%, a difference of 0.010%).
| Demographics | Rating | Rank | 10th Grade |
| Bolivians | 6.7 /100 | #224 | Tragic 93.2% |
| Somalis | 6.2 /100 | #225 | Tragic 93.2% |
| Koreans | 6.1 /100 | #226 | Tragic 93.2% |
| Blacks/African Americans | 6.0 /100 | #227 | Tragic 93.2% |
| Immigrants | China | 5.9 /100 | #228 | Tragic 93.2% |
| Immigrants | Ethiopia | 5.1 /100 | #229 | Tragic 93.1% |
| Immigrants | Africa | 5.0 /100 | #230 | Tragic 93.1% |
| South American Indians | 4.9 /100 | #231 | Tragic 93.1% |
| Bahamians | 4.9 /100 | #232 | Tragic 93.1% |
| Comanche | 4.9 /100 | #233 | Tragic 93.1% |
| Sub-Saharan Africans | 4.7 /100 | #234 | Tragic 93.1% |
| Africans | 4.6 /100 | #235 | Tragic 93.1% |
| Afghans | 4.5 /100 | #236 | Tragic 93.1% |
| Immigrants | Panama | 4.3 /100 | #237 | Tragic 93.1% |
| Nigerians | 4.2 /100 | #238 | Tragic 93.1% |
Demographics Similar to Yugoslavians by 10th Grade
In terms of 10th grade, the demographic groups most similar to Yugoslavians are Soviet Union (94.6%, a difference of 0.010%), Immigrants from Germany (94.6%, a difference of 0.010%), Menominee (94.6%, a difference of 0.010%), Immigrants from Switzerland (94.6%, a difference of 0.020%), and Lebanese (94.6%, a difference of 0.020%).
| Demographics | Rating | Rank | 10th Grade |
| Crow | 99.0 /100 | #85 | Exceptional 94.7% |
| Puget Sound Salish | 99.0 /100 | #86 | Exceptional 94.7% |
| Immigrants | Saudi Arabia | 99.0 /100 | #87 | Exceptional 94.7% |
| Immigrants | Japan | 99.0 /100 | #88 | Exceptional 94.7% |
| Immigrants | Moldova | 98.9 /100 | #89 | Exceptional 94.7% |
| South Africans | 98.8 /100 | #90 | Exceptional 94.7% |
| Whites/Caucasians | 98.8 /100 | #91 | Exceptional 94.7% |
| Yugoslavians | 98.4 /100 | #92 | Exceptional 94.6% |
| Soviet Union | 98.3 /100 | #93 | Exceptional 94.6% |
| Immigrants | Germany | 98.3 /100 | #94 | Exceptional 94.6% |
| Menominee | 98.3 /100 | #95 | Exceptional 94.6% |
| Immigrants | Switzerland | 98.3 /100 | #96 | Exceptional 94.6% |
| Lebanese | 98.3 /100 | #97 | Exceptional 94.6% |
| Immigrants | Bulgaria | 98.1 /100 | #98 | Exceptional 94.6% |
| Immigrants | France | 97.9 /100 | #99 | Exceptional 94.5% |