South American Indian vs Delaware 10th Grade
COMPARE
South American Indian
Delaware
10th Grade
10th Grade Comparison
South American Indians
Delaware
93.1%
10TH GRADE
4.9/ 100
METRIC RATING
231st/ 347
METRIC RANK
94.4%
10TH GRADE
96.3/ 100
METRIC RATING
115th/ 347
METRIC RANK
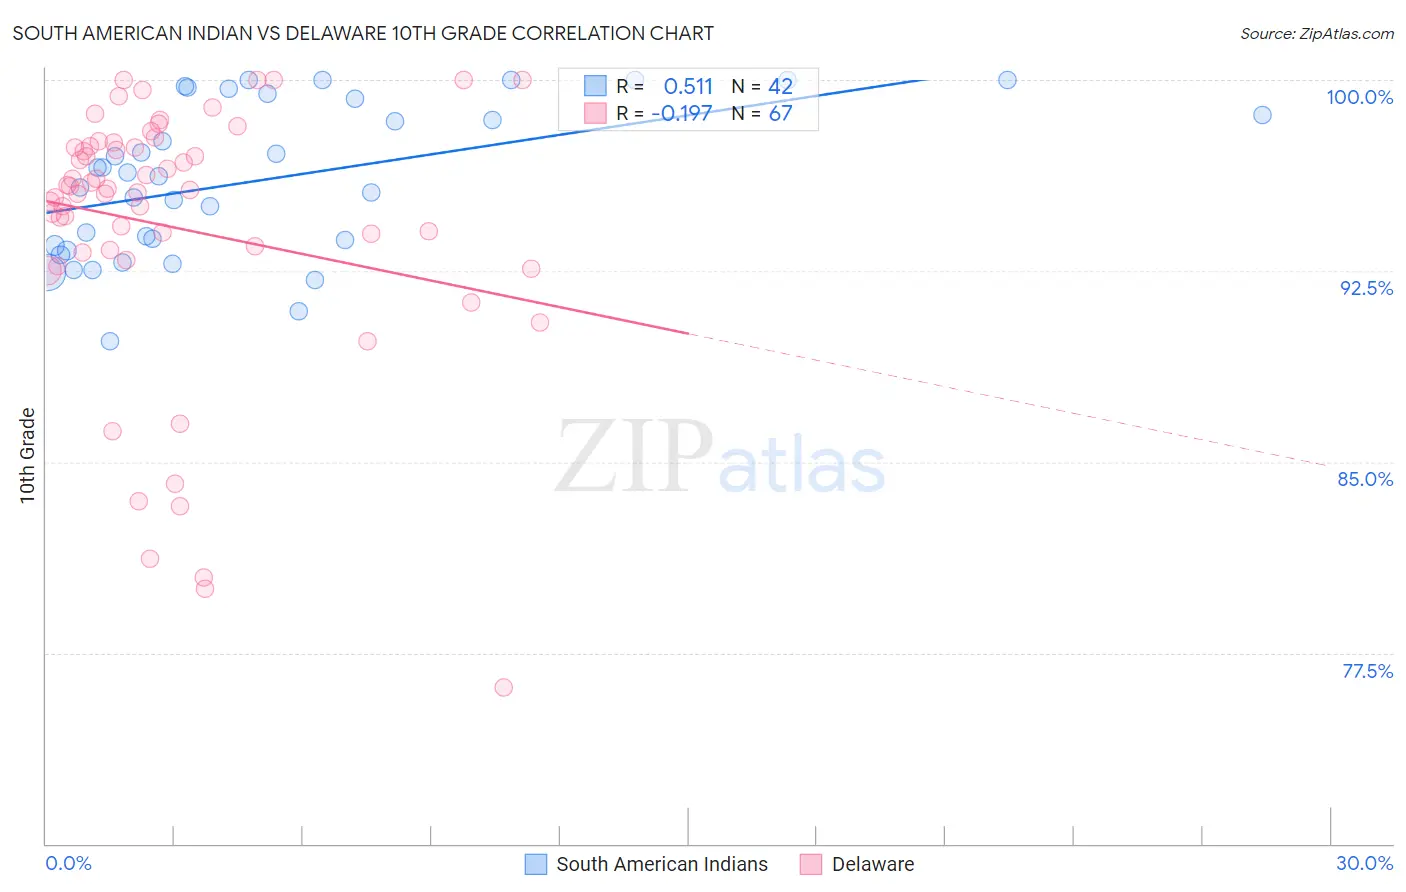
South American Indian vs Delaware 10th Grade Correlation Chart
The statistical analysis conducted on geographies consisting of 164,571,317 people shows a substantial positive correlation between the proportion of South American Indians and percentage of population with at least 10th grade education in the United States with a correlation coefficient (R) of 0.511 and weighted average of 93.1%. Similarly, the statistical analysis conducted on geographies consisting of 96,234,866 people shows a poor negative correlation between the proportion of Delaware and percentage of population with at least 10th grade education in the United States with a correlation coefficient (R) of -0.197 and weighted average of 94.4%, a difference of 1.4%.
10th Grade Correlation Summary
| Measurement | South American Indian | Delaware |
| Minimum | 89.7% | 76.1% |
| Maximum | 100.0% | 100.0% |
| Range | 10.3% | 23.9% |
| Mean | 96.1% | 94.2% |
| Median | 96.3% | 95.7% |
| Interquartile 25% (IQ1) | 93.5% | 93.2% |
| Interquartile 75% (IQ3) | 99.3% | 97.4% |
| Interquartile Range (IQR) | 5.8% | 4.2% |
| Standard Deviation (Sample) | 3.0% | 5.3% |
| Standard Deviation (Population) | 2.9% | 5.3% |
Similar Demographics by 10th Grade
Demographics Similar to South American Indians by 10th Grade
In terms of 10th grade, the demographic groups most similar to South American Indians are Bahamian (93.1%, a difference of 0.0%), Comanche (93.1%, a difference of 0.0%), Immigrants from Ethiopia (93.1%, a difference of 0.010%), Immigrants from Africa (93.1%, a difference of 0.010%), and Subsaharan African (93.1%, a difference of 0.010%).
| Demographics | Rating | Rank | 10th Grade |
| Bolivians | 6.7 /100 | #224 | Tragic 93.2% |
| Somalis | 6.2 /100 | #225 | Tragic 93.2% |
| Koreans | 6.1 /100 | #226 | Tragic 93.2% |
| Blacks/African Americans | 6.0 /100 | #227 | Tragic 93.2% |
| Immigrants | China | 5.9 /100 | #228 | Tragic 93.2% |
| Immigrants | Ethiopia | 5.1 /100 | #229 | Tragic 93.1% |
| Immigrants | Africa | 5.0 /100 | #230 | Tragic 93.1% |
| South American Indians | 4.9 /100 | #231 | Tragic 93.1% |
| Bahamians | 4.9 /100 | #232 | Tragic 93.1% |
| Comanche | 4.9 /100 | #233 | Tragic 93.1% |
| Sub-Saharan Africans | 4.7 /100 | #234 | Tragic 93.1% |
| Africans | 4.6 /100 | #235 | Tragic 93.1% |
| Afghans | 4.5 /100 | #236 | Tragic 93.1% |
| Immigrants | Panama | 4.3 /100 | #237 | Tragic 93.1% |
| Nigerians | 4.2 /100 | #238 | Tragic 93.1% |
Demographics Similar to Delaware by 10th Grade
In terms of 10th grade, the demographic groups most similar to Delaware are German Russian (94.4%, a difference of 0.0%), Sioux (94.4%, a difference of 0.0%), Palestinian (94.4%, a difference of 0.020%), Immigrants from Kuwait (94.4%, a difference of 0.030%), and Immigrants from Hungary (94.4%, a difference of 0.030%).
| Demographics | Rating | Rank | 10th Grade |
| Immigrants | North Macedonia | 97.2 /100 | #108 | Exceptional 94.5% |
| Immigrants | Norway | 97.2 /100 | #109 | Exceptional 94.5% |
| Burmese | 97.1 /100 | #110 | Exceptional 94.5% |
| Immigrants | Zimbabwe | 96.8 /100 | #111 | Exceptional 94.4% |
| Immigrants | Kuwait | 96.8 /100 | #112 | Exceptional 94.4% |
| Palestinians | 96.5 /100 | #113 | Exceptional 94.4% |
| German Russians | 96.3 /100 | #114 | Exceptional 94.4% |
| Delaware | 96.3 /100 | #115 | Exceptional 94.4% |
| Sioux | 96.2 /100 | #116 | Exceptional 94.4% |
| Immigrants | Hungary | 95.8 /100 | #117 | Exceptional 94.4% |
| Jordanians | 95.6 /100 | #118 | Exceptional 94.4% |
| Immigrants | Israel | 95.4 /100 | #119 | Exceptional 94.4% |
| Immigrants | Taiwan | 95.3 /100 | #120 | Exceptional 94.4% |
| Immigrants | Belarus | 95.2 /100 | #121 | Exceptional 94.4% |
| Inupiat | 95.1 /100 | #122 | Exceptional 94.4% |