South African vs Immigrants from Poland Householder Income Ages 25 - 44 years
COMPARE
South African
Immigrants from Poland
Householder Income Ages 25 - 44 years
Householder Income Ages 25 - 44 years Comparison
South Africans
Immigrants from Poland
$103,160
HOUSEHOLDER INCOME AGES 25 - 44 YEARS
99.2/ 100
METRIC RATING
81st/ 347
METRIC RANK
$101,065
HOUSEHOLDER INCOME AGES 25 - 44 YEARS
97.4/ 100
METRIC RATING
104th/ 347
METRIC RANK
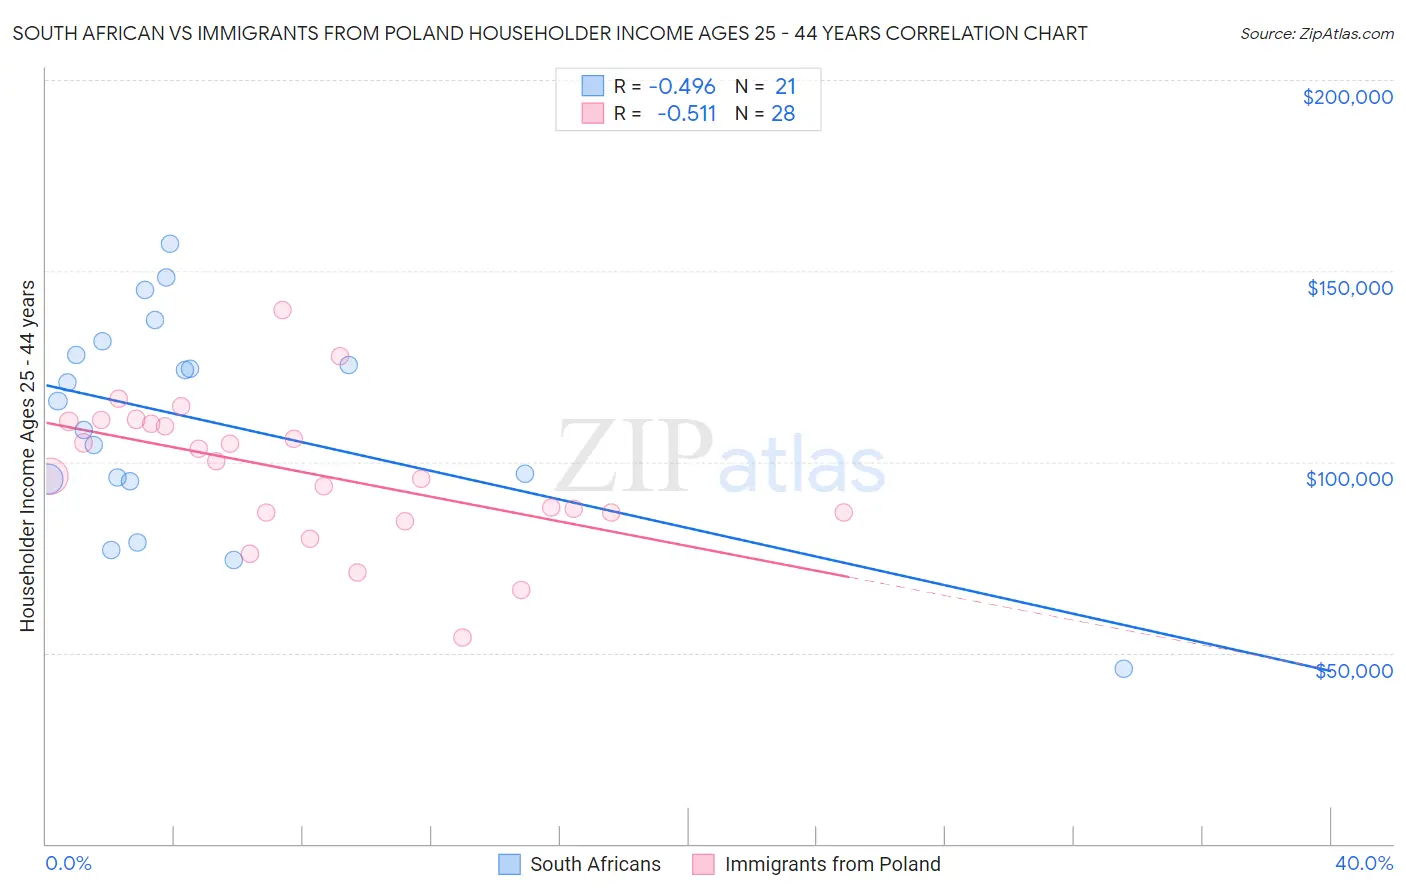
South African vs Immigrants from Poland Householder Income Ages 25 - 44 years Correlation Chart
The statistical analysis conducted on geographies consisting of 182,377,934 people shows a moderate negative correlation between the proportion of South Africans and household income with householder between the ages 25 and 44 in the United States with a correlation coefficient (R) of -0.496 and weighted average of $103,160. Similarly, the statistical analysis conducted on geographies consisting of 304,269,363 people shows a substantial negative correlation between the proportion of Immigrants from Poland and household income with householder between the ages 25 and 44 in the United States with a correlation coefficient (R) of -0.511 and weighted average of $101,065, a difference of 2.1%.
Householder Income Ages 25 - 44 years Correlation Summary
| Measurement | South African | Immigrants from Poland |
| Minimum | $45,714 | $53,849 |
| Maximum | $156,974 | $139,903 |
| Range | $111,260 | $86,054 |
| Mean | $110,921 | $97,277 |
| Median | $115,903 | $98,174 |
| Interquartile 25% (IQ1) | $95,265 | $86,748 |
| Interquartile 75% (IQ3) | $129,677 | $110,162 |
| Interquartile Range (IQR) | $34,411 | $23,414 |
| Standard Deviation (Sample) | $27,826 | $18,764 |
| Standard Deviation (Population) | $27,156 | $18,426 |
Similar Demographics by Householder Income Ages 25 - 44 years
Demographics Similar to South Africans by Householder Income Ages 25 - 44 years
In terms of householder income ages 25 - 44 years, the demographic groups most similar to South Africans are Immigrants from Serbia ($103,155, a difference of 0.010%), Immigrants from Egypt ($103,192, a difference of 0.030%), Argentinean ($103,111, a difference of 0.050%), Armenian ($103,248, a difference of 0.080%), and Immigrants from Philippines ($102,910, a difference of 0.24%).
| Demographics | Rating | Rank | Householder Income Ages 25 - 44 years |
| Immigrants | Fiji | 99.5 /100 | #74 | Exceptional $103,954 |
| Koreans | 99.4 /100 | #75 | Exceptional $103,824 |
| Immigrants | Spain | 99.4 /100 | #76 | Exceptional $103,752 |
| Immigrants | Southern Europe | 99.3 /100 | #77 | Exceptional $103,486 |
| Immigrants | Bulgaria | 99.3 /100 | #78 | Exceptional $103,423 |
| Armenians | 99.2 /100 | #79 | Exceptional $103,248 |
| Immigrants | Egypt | 99.2 /100 | #80 | Exceptional $103,192 |
| South Africans | 99.2 /100 | #81 | Exceptional $103,160 |
| Immigrants | Serbia | 99.2 /100 | #82 | Exceptional $103,155 |
| Argentineans | 99.1 /100 | #83 | Exceptional $103,111 |
| Immigrants | Philippines | 99.0 /100 | #84 | Exceptional $102,910 |
| Immigrants | Ukraine | 98.9 /100 | #85 | Exceptional $102,664 |
| Immigrants | Hungary | 98.9 /100 | #86 | Exceptional $102,655 |
| Immigrants | Western Europe | 98.9 /100 | #87 | Exceptional $102,654 |
| Immigrants | Canada | 98.9 /100 | #88 | Exceptional $102,616 |
Demographics Similar to Immigrants from Poland by Householder Income Ages 25 - 44 years
In terms of householder income ages 25 - 44 years, the demographic groups most similar to Immigrants from Poland are Immigrants from Moldova ($101,091, a difference of 0.030%), Immigrants from Lebanon ($101,124, a difference of 0.060%), Albanian ($101,367, a difference of 0.30%), Immigrants from Argentina ($101,415, a difference of 0.35%), and Taiwanese ($101,492, a difference of 0.42%).
| Demographics | Rating | Rank | Householder Income Ages 25 - 44 years |
| Austrians | 98.3 /100 | #97 | Exceptional $101,842 |
| Immigrants | Kazakhstan | 98.1 /100 | #98 | Exceptional $101,727 |
| Taiwanese | 97.9 /100 | #99 | Exceptional $101,492 |
| Immigrants | Argentina | 97.8 /100 | #100 | Exceptional $101,415 |
| Albanians | 97.8 /100 | #101 | Exceptional $101,367 |
| Immigrants | Lebanon | 97.4 /100 | #102 | Exceptional $101,124 |
| Immigrants | Moldova | 97.4 /100 | #103 | Exceptional $101,091 |
| Immigrants | Poland | 97.4 /100 | #104 | Exceptional $101,065 |
| Immigrants | Vietnam | 96.5 /100 | #105 | Exceptional $100,535 |
| Immigrants | Brazil | 96.5 /100 | #106 | Exceptional $100,534 |
| Northern Europeans | 96.3 /100 | #107 | Exceptional $100,457 |
| Immigrants | South Eastern Asia | 96.0 /100 | #108 | Exceptional $100,283 |
| Immigrants | North Macedonia | 95.6 /100 | #109 | Exceptional $100,101 |
| Immigrants | Afghanistan | 95.3 /100 | #110 | Exceptional $99,977 |
| Chileans | 95.1 /100 | #111 | Exceptional $99,900 |