Nigerian vs Immigrants from Hong Kong 11th Grade
COMPARE
Nigerian
Immigrants from Hong Kong
11th Grade
11th Grade Comparison
Nigerians
Immigrants from Hong Kong
91.8%
11TH GRADE
4.3/ 100
METRIC RATING
229th/ 347
METRIC RANK
92.2%
11TH GRADE
23.3/ 100
METRIC RATING
204th/ 347
METRIC RANK
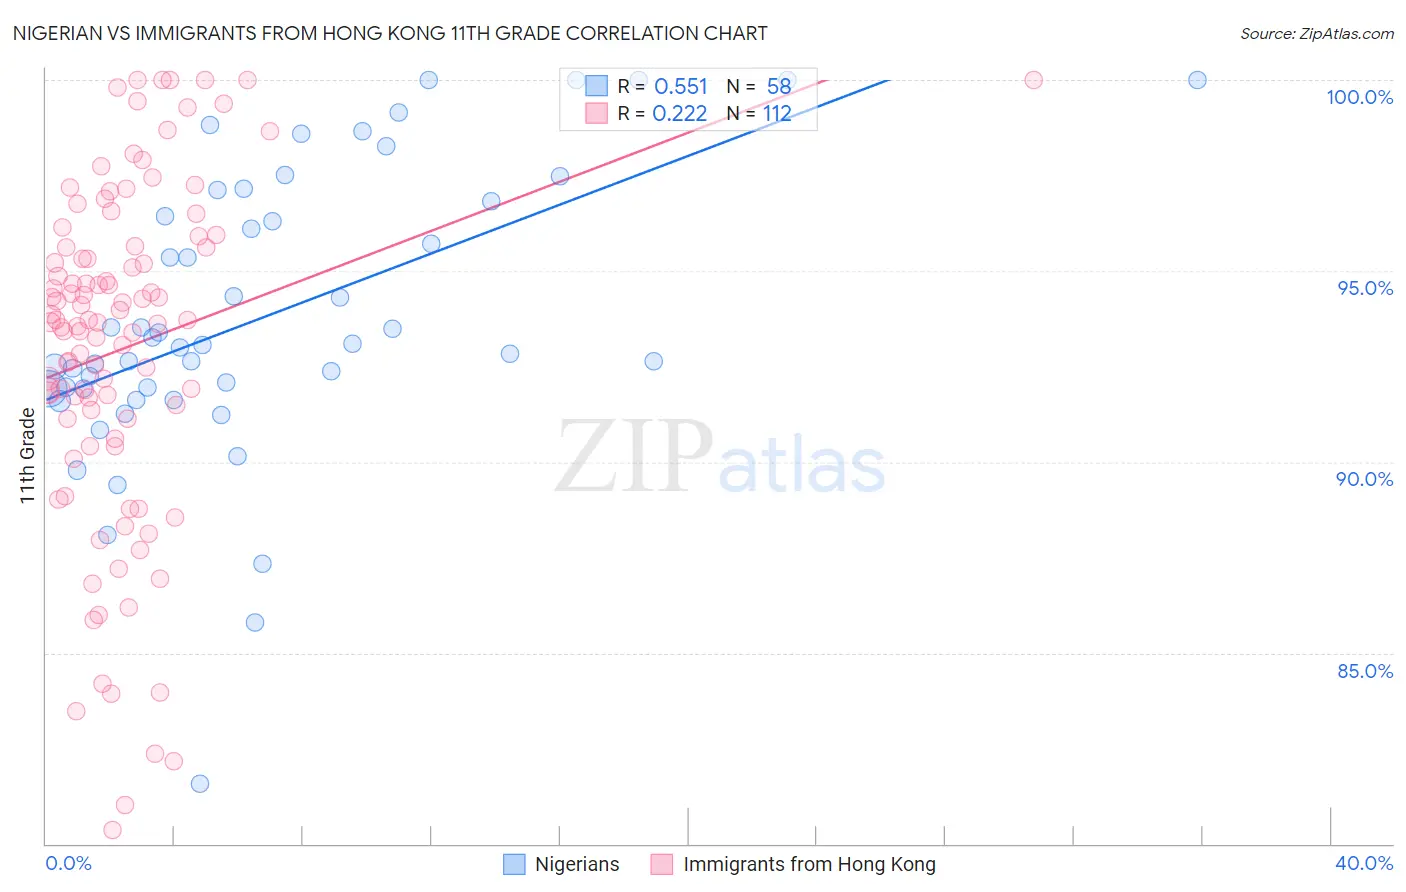
Nigerian vs Immigrants from Hong Kong 11th Grade Correlation Chart
The statistical analysis conducted on geographies consisting of 332,724,627 people shows a substantial positive correlation between the proportion of Nigerians and percentage of population with at least 11th grade education in the United States with a correlation coefficient (R) of 0.551 and weighted average of 91.8%. Similarly, the statistical analysis conducted on geographies consisting of 253,990,250 people shows a weak positive correlation between the proportion of Immigrants from Hong Kong and percentage of population with at least 11th grade education in the United States with a correlation coefficient (R) of 0.222 and weighted average of 92.2%, a difference of 0.47%.
11th Grade Correlation Summary
| Measurement | Nigerian | Immigrants from Hong Kong |
| Minimum | 81.6% | 80.4% |
| Maximum | 100.0% | 100.0% |
| Range | 18.4% | 19.6% |
| Mean | 93.8% | 93.0% |
| Median | 93.1% | 93.7% |
| Interquartile 25% (IQ1) | 91.9% | 91.1% |
| Interquartile 75% (IQ3) | 96.8% | 95.6% |
| Interquartile Range (IQR) | 4.9% | 4.5% |
| Standard Deviation (Sample) | 3.8% | 4.5% |
| Standard Deviation (Population) | 3.7% | 4.4% |
Similar Demographics by 11th Grade
Demographics Similar to Nigerians by 11th Grade
In terms of 11th grade, the demographic groups most similar to Nigerians are Immigrants from Panama (91.8%, a difference of 0.0%), Immigrants from Cameroon (91.8%, a difference of 0.010%), Immigrants from Afghanistan (91.8%, a difference of 0.030%), Choctaw (91.8%, a difference of 0.040%), and Immigrants from Somalia (91.9%, a difference of 0.050%).
| Demographics | Rating | Rank | 11th Grade |
| Immigrants | Africa | 6.5 /100 | #222 | Tragic 91.9% |
| Immigrants | Bahamas | 6.5 /100 | #223 | Tragic 91.9% |
| Costa Ricans | 6.3 /100 | #224 | Tragic 91.9% |
| Immigrants | Zaire | 5.4 /100 | #225 | Tragic 91.9% |
| Immigrants | Somalia | 5.2 /100 | #226 | Tragic 91.9% |
| Immigrants | Cameroon | 4.4 /100 | #227 | Tragic 91.8% |
| Immigrants | Panama | 4.3 /100 | #228 | Tragic 91.8% |
| Nigerians | 4.3 /100 | #229 | Tragic 91.8% |
| Immigrants | Afghanistan | 3.9 /100 | #230 | Tragic 91.8% |
| Choctaw | 3.7 /100 | #231 | Tragic 91.8% |
| Uruguayans | 3.5 /100 | #232 | Tragic 91.8% |
| Cheyenne | 3.3 /100 | #233 | Tragic 91.8% |
| Armenians | 2.9 /100 | #234 | Tragic 91.7% |
| Sub-Saharan Africans | 2.9 /100 | #235 | Tragic 91.7% |
| Colombians | 2.8 /100 | #236 | Tragic 91.7% |
Demographics Similar to Immigrants from Hong Kong by 11th Grade
In terms of 11th grade, the demographic groups most similar to Immigrants from Hong Kong are Immigrants from Sudan (92.3%, a difference of 0.0%), Kiowa (92.2%, a difference of 0.0%), Bolivian (92.2%, a difference of 0.0%), Immigrants from Eastern Africa (92.3%, a difference of 0.010%), and Immigrants from Oceania (92.2%, a difference of 0.010%).
| Demographics | Rating | Rank | 11th Grade |
| Marshallese | 26.0 /100 | #197 | Fair 92.3% |
| Hawaiians | 25.5 /100 | #198 | Fair 92.3% |
| Immigrants | Uganda | 25.2 /100 | #199 | Fair 92.3% |
| Samoans | 25.1 /100 | #200 | Fair 92.3% |
| Immigrants | China | 25.1 /100 | #201 | Fair 92.3% |
| Immigrants | Eastern Africa | 24.1 /100 | #202 | Fair 92.3% |
| Immigrants | Sudan | 23.5 /100 | #203 | Fair 92.3% |
| Immigrants | Hong Kong | 23.3 /100 | #204 | Fair 92.2% |
| Kiowa | 23.2 /100 | #205 | Fair 92.2% |
| Bolivians | 23.2 /100 | #206 | Fair 92.2% |
| Immigrants | Oceania | 22.4 /100 | #207 | Fair 92.2% |
| Colville | 21.8 /100 | #208 | Fair 92.2% |
| Tongans | 19.8 /100 | #209 | Poor 92.2% |
| Ethiopians | 18.8 /100 | #210 | Poor 92.2% |
| Immigrants | Micronesia | 17.7 /100 | #211 | Poor 92.2% |