South African vs Immigrants from Eastern Europe 9th Grade
COMPARE
South African
Immigrants from Eastern Europe
9th Grade
9th Grade Comparison
South Africans
Immigrants from Eastern Europe
95.6%
9TH GRADE
98.8/ 100
METRIC RATING
90th/ 347
METRIC RANK
95.2%
9TH GRADE
85.8/ 100
METRIC RATING
139th/ 347
METRIC RANK
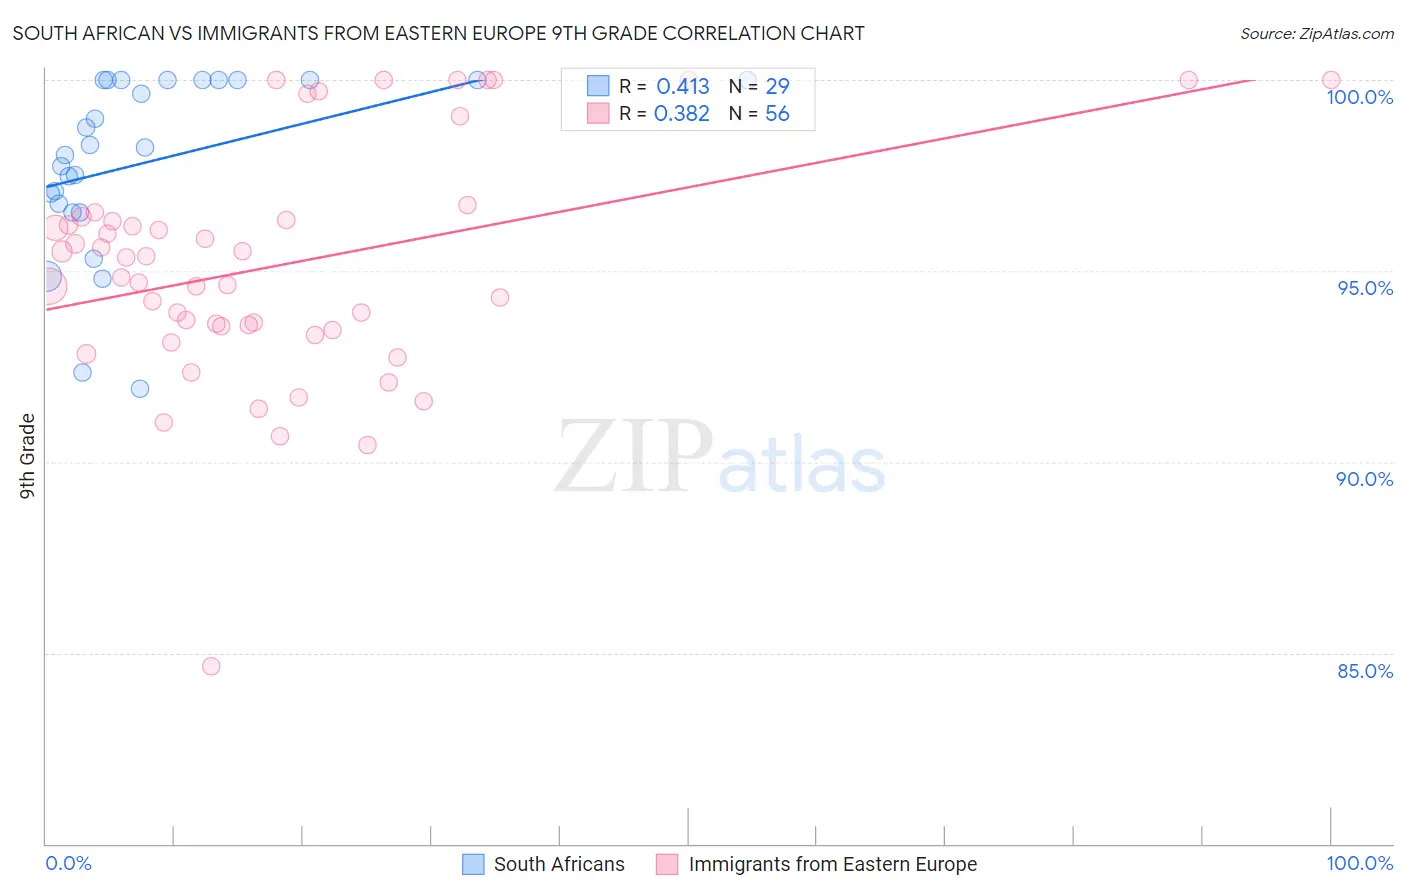
South African vs Immigrants from Eastern Europe 9th Grade Correlation Chart
The statistical analysis conducted on geographies consisting of 182,604,532 people shows a moderate positive correlation between the proportion of South Africans and percentage of population with at least 9th grade education in the United States with a correlation coefficient (R) of 0.413 and weighted average of 95.6%. Similarly, the statistical analysis conducted on geographies consisting of 475,879,420 people shows a mild positive correlation between the proportion of Immigrants from Eastern Europe and percentage of population with at least 9th grade education in the United States with a correlation coefficient (R) of 0.382 and weighted average of 95.2%, a difference of 0.48%.
9th Grade Correlation Summary
| Measurement | South African | Immigrants from Eastern Europe |
| Minimum | 91.9% | 84.6% |
| Maximum | 100.0% | 100.0% |
| Range | 8.1% | 15.4% |
| Mean | 97.9% | 95.2% |
| Median | 98.2% | 95.1% |
| Interquartile 25% (IQ1) | 96.6% | 93.5% |
| Interquartile 75% (IQ3) | 100.0% | 96.4% |
| Interquartile Range (IQR) | 3.4% | 2.9% |
| Standard Deviation (Sample) | 2.3% | 3.1% |
| Standard Deviation (Population) | 2.3% | 3.1% |
Similar Demographics by 9th Grade
Demographics Similar to South Africans by 9th Grade
In terms of 9th grade, the demographic groups most similar to South Africans are Immigrants from Czechoslovakia (95.7%, a difference of 0.010%), Yugoslavian (95.7%, a difference of 0.010%), Creek (95.6%, a difference of 0.010%), Immigrants from Saudi Arabia (95.6%, a difference of 0.010%), and Okinawan (95.7%, a difference of 0.020%).
| Demographics | Rating | Rank | 9th Grade |
| Swiss | 99.2 /100 | #83 | Exceptional 95.7% |
| Immigrants | Denmark | 99.1 /100 | #84 | Exceptional 95.7% |
| Icelanders | 99.1 /100 | #85 | Exceptional 95.7% |
| Immigrants | Western Europe | 99.1 /100 | #86 | Exceptional 95.7% |
| Okinawans | 99.0 /100 | #87 | Exceptional 95.7% |
| Immigrants | Czechoslovakia | 98.9 /100 | #88 | Exceptional 95.7% |
| Yugoslavians | 98.9 /100 | #89 | Exceptional 95.7% |
| South Africans | 98.8 /100 | #90 | Exceptional 95.6% |
| Creek | 98.8 /100 | #91 | Exceptional 95.6% |
| Immigrants | Saudi Arabia | 98.8 /100 | #92 | Exceptional 95.6% |
| Immigrants | Germany | 98.7 /100 | #93 | Exceptional 95.6% |
| Immigrants | Latvia | 98.7 /100 | #94 | Exceptional 95.6% |
| Americans | 98.5 /100 | #95 | Exceptional 95.6% |
| Filipinos | 98.5 /100 | #96 | Exceptional 95.6% |
| Delaware | 98.4 /100 | #97 | Exceptional 95.6% |
Demographics Similar to Immigrants from Eastern Europe by 9th Grade
In terms of 9th grade, the demographic groups most similar to Immigrants from Eastern Europe are Immigrants from Russia (95.2%, a difference of 0.010%), Immigrants from Taiwan (95.2%, a difference of 0.010%), Immigrants from Bosnia and Herzegovina (95.2%, a difference of 0.010%), Immigrants from Greece (95.2%, a difference of 0.020%), and Spanish (95.2%, a difference of 0.020%).
| Demographics | Rating | Rank | 9th Grade |
| Immigrants | Nonimmigrants | 92.0 /100 | #132 | Exceptional 95.3% |
| Israelis | 90.4 /100 | #133 | Exceptional 95.3% |
| Immigrants | Israel | 89.6 /100 | #134 | Excellent 95.3% |
| Immigrants | Belarus | 88.9 /100 | #135 | Excellent 95.2% |
| Immigrants | Iran | 88.3 /100 | #136 | Excellent 95.2% |
| Hmong | 87.7 /100 | #137 | Excellent 95.2% |
| Immigrants | Russia | 86.6 /100 | #138 | Excellent 95.2% |
| Immigrants | Eastern Europe | 85.8 /100 | #139 | Excellent 95.2% |
| Immigrants | Taiwan | 85.3 /100 | #140 | Excellent 95.2% |
| Immigrants | Bosnia and Herzegovina | 85.2 /100 | #141 | Excellent 95.2% |
| Immigrants | Greece | 84.6 /100 | #142 | Excellent 95.2% |
| Spanish | 84.4 /100 | #143 | Excellent 95.2% |
| Yup'ik | 83.3 /100 | #144 | Excellent 95.2% |
| Pueblo | 82.2 /100 | #145 | Excellent 95.1% |
| Immigrants | Sri Lanka | 82.1 /100 | #146 | Excellent 95.1% |