South African vs Zimbabwean No Schooling Completed
COMPARE
South African
Zimbabwean
No Schooling Completed
No Schooling Completed Comparison
South Africans
Zimbabweans
1.8%
NO SCHOOLING COMPLETED
99.1/ 100
METRIC RATING
89th/ 347
METRIC RANK
1.7%
NO SCHOOLING COMPLETED
99.4/ 100
METRIC RATING
74th/ 347
METRIC RANK
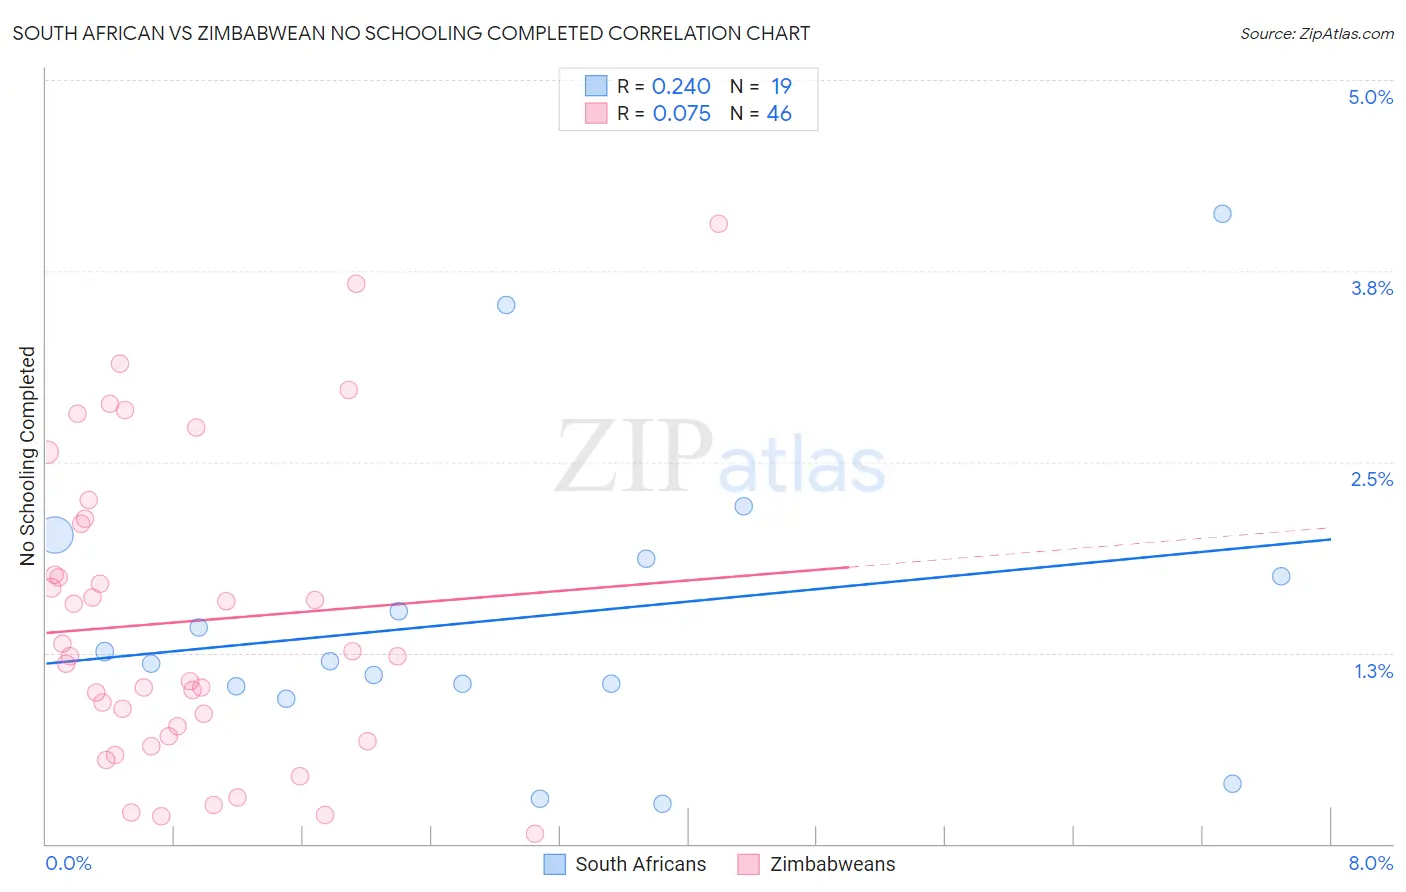
South African vs Zimbabwean No Schooling Completed Correlation Chart
The statistical analysis conducted on geographies consisting of 181,622,375 people shows a weak positive correlation between the proportion of South Africans and percentage of population with no schooling in the United States with a correlation coefficient (R) of 0.240 and weighted average of 1.8%. Similarly, the statistical analysis conducted on geographies consisting of 69,120,863 people shows a slight positive correlation between the proportion of Zimbabweans and percentage of population with no schooling in the United States with a correlation coefficient (R) of 0.075 and weighted average of 1.7%, a difference of 1.7%.
No Schooling Completed Correlation Summary
| Measurement | South African | Zimbabwean |
| Minimum | 0.27% | 0.063% |
| Maximum | 4.1% | 4.1% |
| Range | 3.9% | 4.0% |
| Mean | 1.5% | 1.5% |
| Median | 1.2% | 1.2% |
| Interquartile 25% (IQ1) | 1.0% | 0.71% |
| Interquartile 75% (IQ3) | 1.9% | 2.1% |
| Interquartile Range (IQR) | 0.84% | 1.4% |
| Standard Deviation (Sample) | 0.99% | 0.99% |
| Standard Deviation (Population) | 0.96% | 0.98% |
Demographics Similar to South Africans and Zimbabweans by No Schooling Completed
In terms of no schooling completed, the demographic groups most similar to South Africans are Immigrants from Western Europe (1.8%, a difference of 0.040%), Osage (1.8%, a difference of 0.080%), Ukrainian (1.8%, a difference of 0.40%), Immigrants from Australia (1.7%, a difference of 0.44%), and Immigrants from Denmark (1.7%, a difference of 0.48%). Similarly, the demographic groups most similar to Zimbabweans are Immigrants from India (1.7%, a difference of 0.020%), Cajun (1.7%, a difference of 0.50%), Immigrants from Belgium (1.7%, a difference of 0.58%), Cherokee (1.7%, a difference of 0.63%), and Immigrants from England (1.7%, a difference of 0.68%).
| Demographics | Rating | Rank | No Schooling Completed |
| Immigrants | England | 99.5 /100 | #71 | Exceptional 1.7% |
| Cajuns | 99.5 /100 | #72 | Exceptional 1.7% |
| Immigrants | India | 99.4 /100 | #73 | Exceptional 1.7% |
| Zimbabweans | 99.4 /100 | #74 | Exceptional 1.7% |
| Immigrants | Belgium | 99.3 /100 | #75 | Exceptional 1.7% |
| Cherokee | 99.3 /100 | #76 | Exceptional 1.7% |
| Immigrants | Sweden | 99.3 /100 | #77 | Exceptional 1.7% |
| Delaware | 99.3 /100 | #78 | Exceptional 1.7% |
| Macedonians | 99.3 /100 | #79 | Exceptional 1.7% |
| Cypriots | 99.3 /100 | #80 | Exceptional 1.7% |
| Icelanders | 99.3 /100 | #81 | Exceptional 1.7% |
| Immigrants | South Africa | 99.3 /100 | #82 | Exceptional 1.7% |
| Potawatomi | 99.3 /100 | #83 | Exceptional 1.7% |
| Immigrants | Denmark | 99.2 /100 | #84 | Exceptional 1.7% |
| Immigrants | Australia | 99.2 /100 | #85 | Exceptional 1.7% |
| Ukrainians | 99.2 /100 | #86 | Exceptional 1.8% |
| Osage | 99.2 /100 | #87 | Exceptional 1.8% |
| Immigrants | Western Europe | 99.2 /100 | #88 | Exceptional 1.8% |
| South Africans | 99.1 /100 | #89 | Exceptional 1.8% |
| Sioux | 99.0 /100 | #90 | Exceptional 1.8% |
| Immigrants | Germany | 99.0 /100 | #91 | Exceptional 1.8% |