Somali vs Immigrants from Honduras 5th Grade
COMPARE
Somali
Immigrants from Honduras
5th Grade
5th Grade Comparison
Somalis
Immigrants from Honduras
96.5%
5TH GRADE
0.0/ 100
METRIC RATING
292nd/ 347
METRIC RANK
95.4%
5TH GRADE
0.0/ 100
METRIC RATING
331st/ 347
METRIC RANK
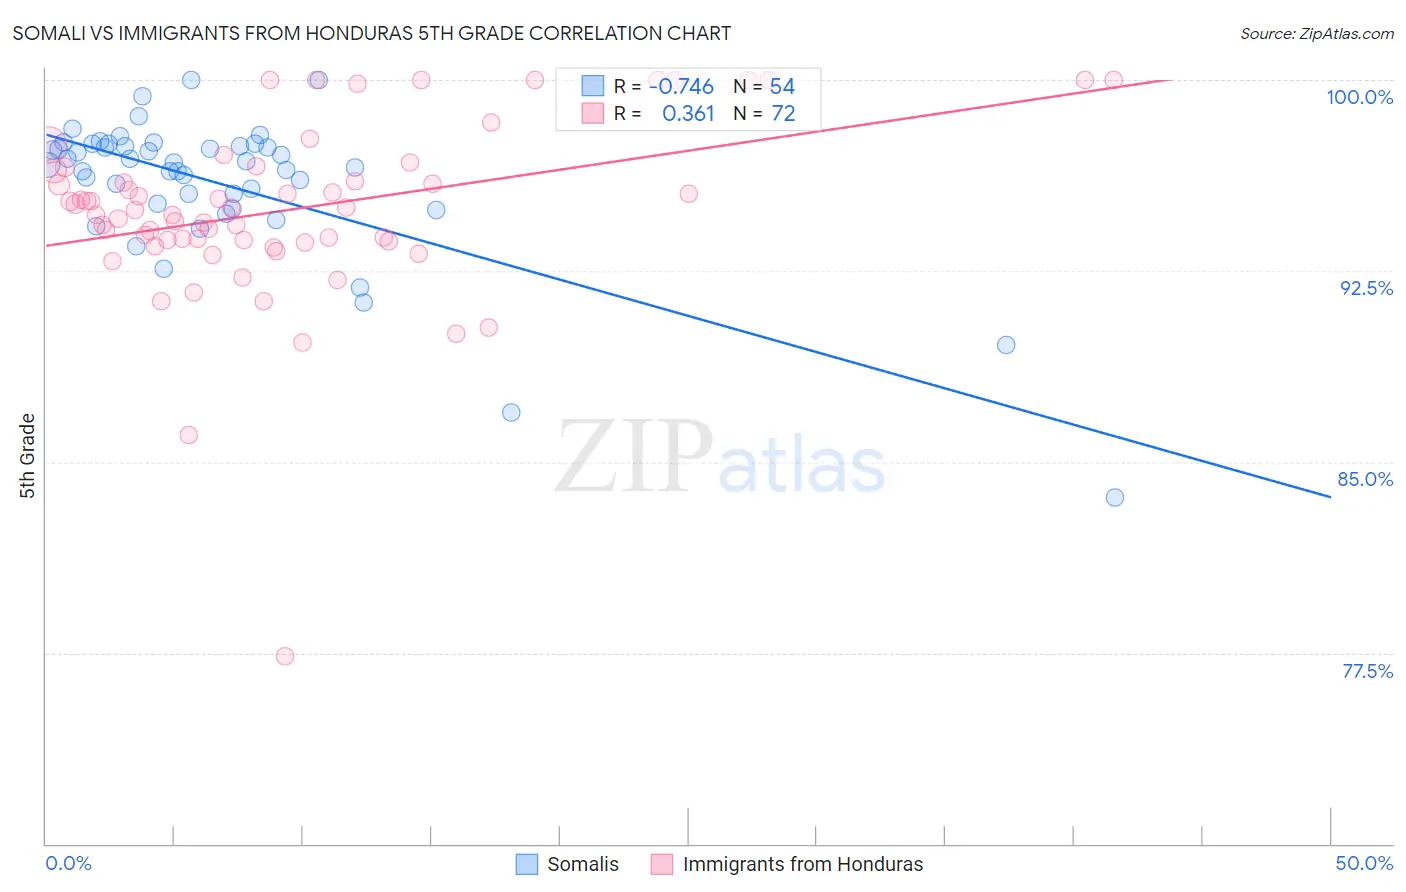
Somali vs Immigrants from Honduras 5th Grade Correlation Chart
The statistical analysis conducted on geographies consisting of 99,332,457 people shows a strong negative correlation between the proportion of Somalis and percentage of population with at least 5th grade education in the United States with a correlation coefficient (R) of -0.746 and weighted average of 96.5%. Similarly, the statistical analysis conducted on geographies consisting of 322,637,445 people shows a mild positive correlation between the proportion of Immigrants from Honduras and percentage of population with at least 5th grade education in the United States with a correlation coefficient (R) of 0.361 and weighted average of 95.4%, a difference of 1.1%.
5th Grade Correlation Summary
| Measurement | Somali | Immigrants from Honduras |
| Minimum | 83.6% | 77.4% |
| Maximum | 100.0% | 100.0% |
| Range | 16.4% | 22.6% |
| Mean | 95.9% | 94.9% |
| Median | 96.7% | 94.9% |
| Interquartile 25% (IQ1) | 95.1% | 93.7% |
| Interquartile 75% (IQ3) | 97.4% | 96.5% |
| Interquartile Range (IQR) | 2.3% | 2.8% |
| Standard Deviation (Sample) | 2.9% | 3.5% |
| Standard Deviation (Population) | 2.9% | 3.5% |
Similar Demographics by 5th Grade
Demographics Similar to Somalis by 5th Grade
In terms of 5th grade, the demographic groups most similar to Somalis are Malaysian (96.5%, a difference of 0.0%), British West Indian (96.5%, a difference of 0.010%), Immigrants from Grenada (96.5%, a difference of 0.010%), Immigrants from West Indies (96.5%, a difference of 0.020%), and Immigrants from Eritrea (96.4%, a difference of 0.050%).
| Demographics | Rating | Rank | 5th Grade |
| Immigrants | St. Vincent and the Grenadines | 0.1 /100 | #285 | Tragic 96.6% |
| Immigrants | Thailand | 0.1 /100 | #286 | Tragic 96.6% |
| Immigrants | Afghanistan | 0.1 /100 | #287 | Tragic 96.6% |
| Immigrants | Barbados | 0.0 /100 | #288 | Tragic 96.6% |
| Immigrants | West Indies | 0.0 /100 | #289 | Tragic 96.5% |
| British West Indians | 0.0 /100 | #290 | Tragic 96.5% |
| Malaysians | 0.0 /100 | #291 | Tragic 96.5% |
| Somalis | 0.0 /100 | #292 | Tragic 96.5% |
| Immigrants | Grenada | 0.0 /100 | #293 | Tragic 96.5% |
| Immigrants | Eritrea | 0.0 /100 | #294 | Tragic 96.4% |
| Immigrants | Somalia | 0.0 /100 | #295 | Tragic 96.4% |
| Immigrants | South Eastern Asia | 0.0 /100 | #296 | Tragic 96.3% |
| Haitians | 0.0 /100 | #297 | Tragic 96.3% |
| Immigrants | Dominica | 0.0 /100 | #298 | Tragic 96.2% |
| Immigrants | Immigrants | 0.0 /100 | #299 | Tragic 96.2% |
Demographics Similar to Immigrants from Honduras by 5th Grade
In terms of 5th grade, the demographic groups most similar to Immigrants from Honduras are Immigrants from Armenia (95.4%, a difference of 0.050%), Immigrants from Dominican Republic (95.3%, a difference of 0.10%), Immigrants from Latin America (95.3%, a difference of 0.11%), Mexican American Indian (95.5%, a difference of 0.14%), and Nepalese (95.2%, a difference of 0.14%).
| Demographics | Rating | Rank | 5th Grade |
| Hondurans | 0.0 /100 | #324 | Tragic 95.6% |
| Hispanics or Latinos | 0.0 /100 | #325 | Tragic 95.6% |
| Immigrants | Cambodia | 0.0 /100 | #326 | Tragic 95.5% |
| Dominicans | 0.0 /100 | #327 | Tragic 95.5% |
| Cape Verdeans | 0.0 /100 | #328 | Tragic 95.5% |
| Mexican American Indians | 0.0 /100 | #329 | Tragic 95.5% |
| Immigrants | Armenia | 0.0 /100 | #330 | Tragic 95.4% |
| Immigrants | Honduras | 0.0 /100 | #331 | Tragic 95.4% |
| Immigrants | Dominican Republic | 0.0 /100 | #332 | Tragic 95.3% |
| Immigrants | Latin America | 0.0 /100 | #333 | Tragic 95.3% |
| Nepalese | 0.0 /100 | #334 | Tragic 95.2% |
| Mexicans | 0.0 /100 | #335 | Tragic 95.2% |
| Immigrants | Azores | 0.0 /100 | #336 | Tragic 95.1% |
| Central Americans | 0.0 /100 | #337 | Tragic 95.1% |
| Immigrants | Cabo Verde | 0.0 /100 | #338 | Tragic 94.9% |