Somali vs Immigrants from Spain 5th Grade
COMPARE
Somali
Immigrants from Spain
5th Grade
5th Grade Comparison
Somalis
Immigrants from Spain
96.5%
5TH GRADE
0.0/ 100
METRIC RATING
292nd/ 347
METRIC RANK
97.3%
5TH GRADE
47.0/ 100
METRIC RATING
177th/ 347
METRIC RANK
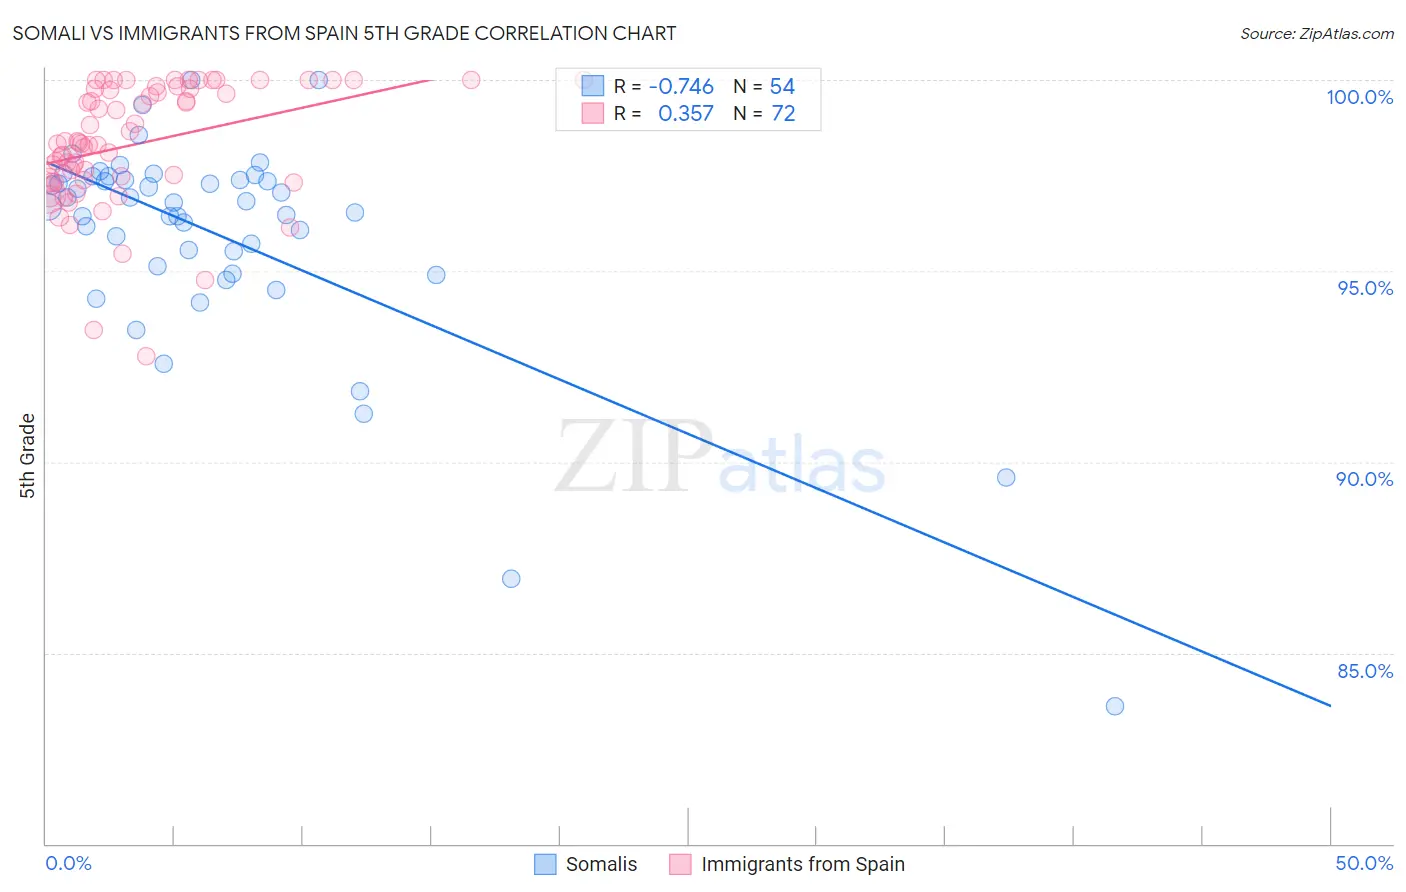
Somali vs Immigrants from Spain 5th Grade Correlation Chart
The statistical analysis conducted on geographies consisting of 99,332,457 people shows a strong negative correlation between the proportion of Somalis and percentage of population with at least 5th grade education in the United States with a correlation coefficient (R) of -0.746 and weighted average of 96.5%. Similarly, the statistical analysis conducted on geographies consisting of 239,682,725 people shows a mild positive correlation between the proportion of Immigrants from Spain and percentage of population with at least 5th grade education in the United States with a correlation coefficient (R) of 0.357 and weighted average of 97.3%, a difference of 0.88%.
5th Grade Correlation Summary
| Measurement | Somali | Immigrants from Spain |
| Minimum | 83.6% | 92.8% |
| Maximum | 100.0% | 100.0% |
| Range | 16.4% | 7.2% |
| Mean | 95.9% | 98.3% |
| Median | 96.7% | 98.3% |
| Interquartile 25% (IQ1) | 95.1% | 97.4% |
| Interquartile 75% (IQ3) | 97.4% | 99.8% |
| Interquartile Range (IQR) | 2.3% | 2.4% |
| Standard Deviation (Sample) | 2.9% | 1.6% |
| Standard Deviation (Population) | 2.9% | 1.6% |
Similar Demographics by 5th Grade
Demographics Similar to Somalis by 5th Grade
In terms of 5th grade, the demographic groups most similar to Somalis are Malaysian (96.5%, a difference of 0.0%), British West Indian (96.5%, a difference of 0.010%), Immigrants from Grenada (96.5%, a difference of 0.010%), Immigrants from West Indies (96.5%, a difference of 0.020%), and Immigrants from Eritrea (96.4%, a difference of 0.050%).
| Demographics | Rating | Rank | 5th Grade |
| Immigrants | St. Vincent and the Grenadines | 0.1 /100 | #285 | Tragic 96.6% |
| Immigrants | Thailand | 0.1 /100 | #286 | Tragic 96.6% |
| Immigrants | Afghanistan | 0.1 /100 | #287 | Tragic 96.6% |
| Immigrants | Barbados | 0.0 /100 | #288 | Tragic 96.6% |
| Immigrants | West Indies | 0.0 /100 | #289 | Tragic 96.5% |
| British West Indians | 0.0 /100 | #290 | Tragic 96.5% |
| Malaysians | 0.0 /100 | #291 | Tragic 96.5% |
| Somalis | 0.0 /100 | #292 | Tragic 96.5% |
| Immigrants | Grenada | 0.0 /100 | #293 | Tragic 96.5% |
| Immigrants | Eritrea | 0.0 /100 | #294 | Tragic 96.4% |
| Immigrants | Somalia | 0.0 /100 | #295 | Tragic 96.4% |
| Immigrants | South Eastern Asia | 0.0 /100 | #296 | Tragic 96.3% |
| Haitians | 0.0 /100 | #297 | Tragic 96.3% |
| Immigrants | Dominica | 0.0 /100 | #298 | Tragic 96.2% |
| Immigrants | Immigrants | 0.0 /100 | #299 | Tragic 96.2% |
Demographics Similar to Immigrants from Spain by 5th Grade
In terms of 5th grade, the demographic groups most similar to Immigrants from Spain are Immigrants from Kazakhstan (97.3%, a difference of 0.010%), Immigrants from Micronesia (97.3%, a difference of 0.010%), Immigrants from Taiwan (97.3%, a difference of 0.010%), Egyptian (97.3%, a difference of 0.020%), and Comanche (97.3%, a difference of 0.020%).
| Demographics | Rating | Rank | 5th Grade |
| Venezuelans | 54.0 /100 | #170 | Average 97.3% |
| Immigrants | Sri Lanka | 53.8 /100 | #171 | Average 97.3% |
| Arabs | 53.4 /100 | #172 | Average 97.3% |
| Egyptians | 52.4 /100 | #173 | Average 97.3% |
| Immigrants | Kazakhstan | 50.0 /100 | #174 | Average 97.3% |
| Immigrants | Micronesia | 48.8 /100 | #175 | Average 97.3% |
| Immigrants | Taiwan | 48.4 /100 | #176 | Average 97.3% |
| Immigrants | Spain | 47.0 /100 | #177 | Average 97.3% |
| Comanche | 42.1 /100 | #178 | Average 97.3% |
| Immigrants | Kenya | 40.3 /100 | #179 | Average 97.3% |
| Pakistanis | 40.2 /100 | #180 | Average 97.3% |
| Argentineans | 39.5 /100 | #181 | Fair 97.3% |
| Mongolians | 39.4 /100 | #182 | Fair 97.3% |
| Immigrants | Ukraine | 38.6 /100 | #183 | Fair 97.3% |
| Immigrants | Venezuela | 38.4 /100 | #184 | Fair 97.3% |