Somali vs Yup'ik 5th Grade
COMPARE
Somali
Yup'ik
5th Grade
5th Grade Comparison
Somalis
Yup'ik
96.5%
5TH GRADE
0.0/ 100
METRIC RATING
292nd/ 347
METRIC RANK
98.2%
5TH GRADE
100.0/ 100
METRIC RATING
25th/ 347
METRIC RANK
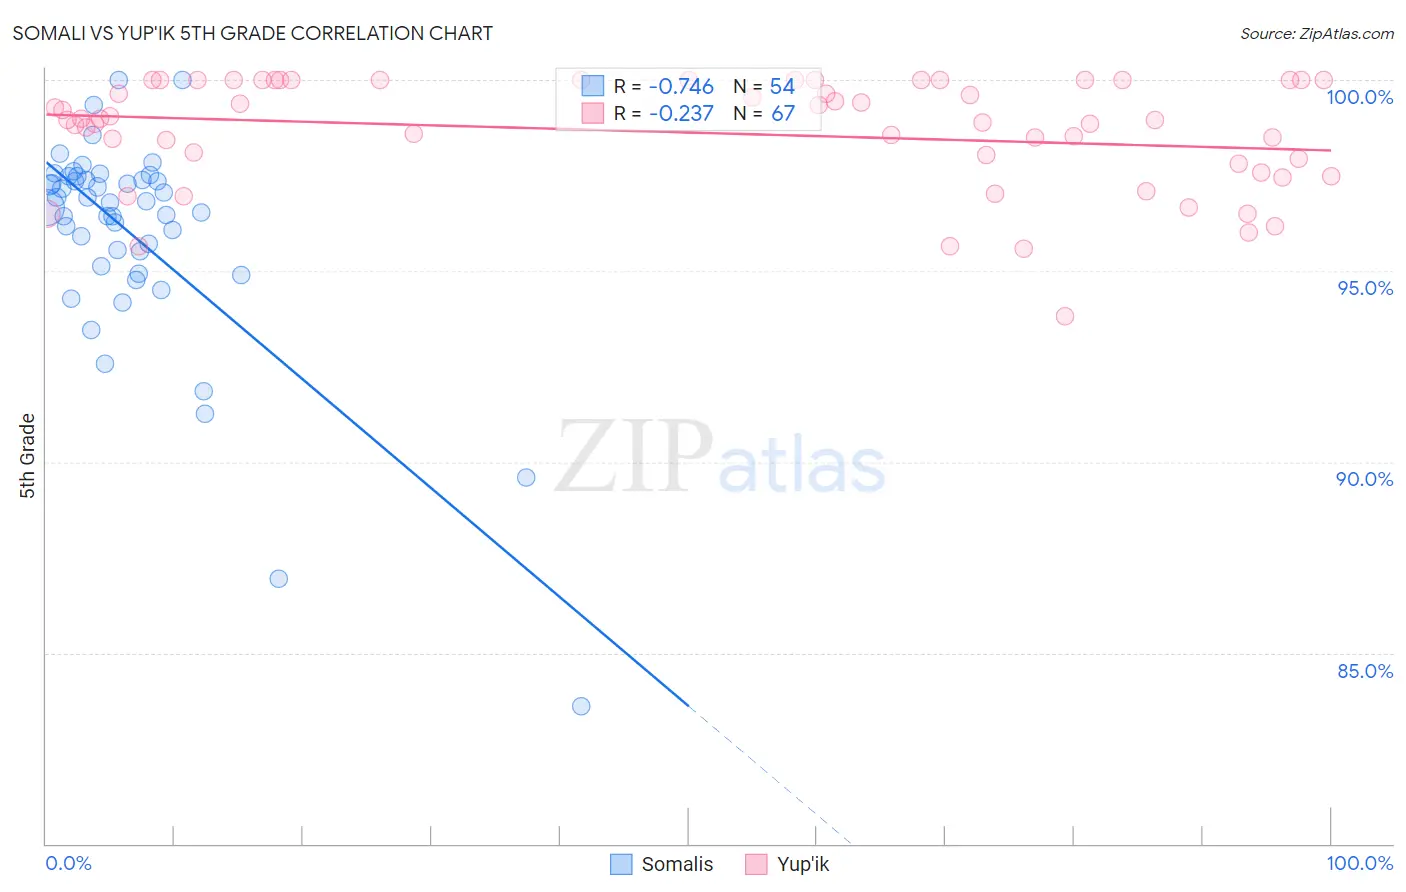
Somali vs Yup'ik 5th Grade Correlation Chart
The statistical analysis conducted on geographies consisting of 99,332,457 people shows a strong negative correlation between the proportion of Somalis and percentage of population with at least 5th grade education in the United States with a correlation coefficient (R) of -0.746 and weighted average of 96.5%. Similarly, the statistical analysis conducted on geographies consisting of 39,964,464 people shows a weak negative correlation between the proportion of Yup'ik and percentage of population with at least 5th grade education in the United States with a correlation coefficient (R) of -0.237 and weighted average of 98.2%, a difference of 1.8%.
5th Grade Correlation Summary
| Measurement | Somali | Yup'ik |
| Minimum | 83.6% | 93.8% |
| Maximum | 100.0% | 100.0% |
| Range | 16.4% | 6.2% |
| Mean | 95.9% | 98.6% |
| Median | 96.7% | 99.0% |
| Interquartile 25% (IQ1) | 95.1% | 97.8% |
| Interquartile 75% (IQ3) | 97.4% | 100.0% |
| Interquartile Range (IQR) | 2.3% | 2.2% |
| Standard Deviation (Sample) | 2.9% | 1.4% |
| Standard Deviation (Population) | 2.9% | 1.4% |
Similar Demographics by 5th Grade
Demographics Similar to Somalis by 5th Grade
In terms of 5th grade, the demographic groups most similar to Somalis are Malaysian (96.5%, a difference of 0.0%), British West Indian (96.5%, a difference of 0.010%), Immigrants from Grenada (96.5%, a difference of 0.010%), Immigrants from West Indies (96.5%, a difference of 0.020%), and Immigrants from Eritrea (96.4%, a difference of 0.050%).
| Demographics | Rating | Rank | 5th Grade |
| Immigrants | St. Vincent and the Grenadines | 0.1 /100 | #285 | Tragic 96.6% |
| Immigrants | Thailand | 0.1 /100 | #286 | Tragic 96.6% |
| Immigrants | Afghanistan | 0.1 /100 | #287 | Tragic 96.6% |
| Immigrants | Barbados | 0.0 /100 | #288 | Tragic 96.6% |
| Immigrants | West Indies | 0.0 /100 | #289 | Tragic 96.5% |
| British West Indians | 0.0 /100 | #290 | Tragic 96.5% |
| Malaysians | 0.0 /100 | #291 | Tragic 96.5% |
| Somalis | 0.0 /100 | #292 | Tragic 96.5% |
| Immigrants | Grenada | 0.0 /100 | #293 | Tragic 96.5% |
| Immigrants | Eritrea | 0.0 /100 | #294 | Tragic 96.4% |
| Immigrants | Somalia | 0.0 /100 | #295 | Tragic 96.4% |
| Immigrants | South Eastern Asia | 0.0 /100 | #296 | Tragic 96.3% |
| Haitians | 0.0 /100 | #297 | Tragic 96.3% |
| Immigrants | Dominica | 0.0 /100 | #298 | Tragic 96.2% |
| Immigrants | Immigrants | 0.0 /100 | #299 | Tragic 96.2% |
Demographics Similar to Yup'ik by 5th Grade
In terms of 5th grade, the demographic groups most similar to Yup'ik are Alaska Native (98.2%, a difference of 0.0%), Croatian (98.2%, a difference of 0.010%), Sioux (98.2%, a difference of 0.010%), Scotch-Irish (98.2%, a difference of 0.010%), and French (98.2%, a difference of 0.010%).
| Demographics | Rating | Rank | 5th Grade |
| Pennsylvania Germans | 100.0 /100 | #18 | Exceptional 98.3% |
| Finns | 100.0 /100 | #19 | Exceptional 98.2% |
| Lithuanians | 100.0 /100 | #20 | Exceptional 98.2% |
| Danes | 100.0 /100 | #21 | Exceptional 98.2% |
| Croatians | 100.0 /100 | #22 | Exceptional 98.2% |
| Sioux | 100.0 /100 | #23 | Exceptional 98.2% |
| Scotch-Irish | 100.0 /100 | #24 | Exceptional 98.2% |
| Yup'ik | 100.0 /100 | #25 | Exceptional 98.2% |
| Alaska Natives | 100.0 /100 | #26 | Exceptional 98.2% |
| French | 100.0 /100 | #27 | Exceptional 98.2% |
| Czechs | 100.0 /100 | #28 | Exceptional 98.2% |
| Scandinavians | 100.0 /100 | #29 | Exceptional 98.2% |
| French Canadians | 100.0 /100 | #30 | Exceptional 98.2% |
| Europeans | 100.0 /100 | #31 | Exceptional 98.2% |
| Chippewa | 100.0 /100 | #32 | Exceptional 98.1% |