Somali vs Immigrants from Europe Professional Degree
COMPARE
Somali
Immigrants from Europe
Professional Degree
Professional Degree Comparison
Somalis
Immigrants from Europe
4.1%
PROFESSIONAL DEGREE
14.8/ 100
METRIC RATING
205th/ 347
METRIC RANK
5.6%
PROFESSIONAL DEGREE
100.0/ 100
METRIC RATING
59th/ 347
METRIC RANK
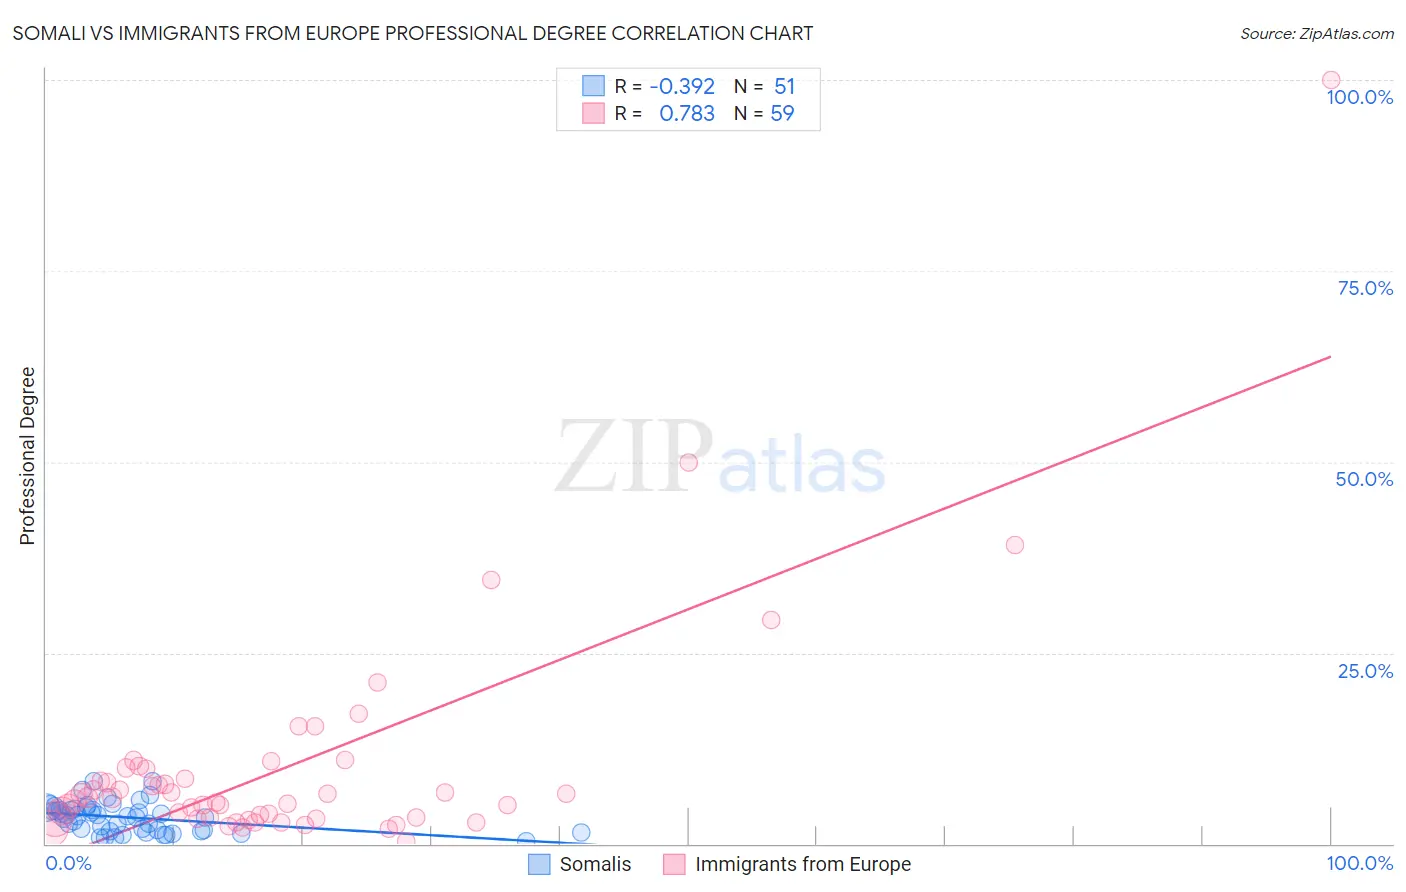
Somali vs Immigrants from Europe Professional Degree Correlation Chart
The statistical analysis conducted on geographies consisting of 99,274,303 people shows a mild negative correlation between the proportion of Somalis and percentage of population with at least professional degree education in the United States with a correlation coefficient (R) of -0.392 and weighted average of 4.1%. Similarly, the statistical analysis conducted on geographies consisting of 543,310,657 people shows a strong positive correlation between the proportion of Immigrants from Europe and percentage of population with at least professional degree education in the United States with a correlation coefficient (R) of 0.783 and weighted average of 5.6%, a difference of 36.6%.
Professional Degree Correlation Summary
| Measurement | Somali | Immigrants from Europe |
| Minimum | 0.40% | 0.35% |
| Maximum | 8.1% | 100.0% |
| Range | 7.7% | 99.6% |
| Mean | 3.4% | 10.1% |
| Median | 3.5% | 6.0% |
| Interquartile 25% (IQ1) | 1.7% | 3.3% |
| Interquartile 75% (IQ3) | 4.6% | 9.9% |
| Interquartile Range (IQR) | 2.9% | 6.6% |
| Standard Deviation (Sample) | 1.9% | 15.1% |
| Standard Deviation (Population) | 1.9% | 14.9% |
Similar Demographics by Professional Degree
Demographics Similar to Somalis by Professional Degree
In terms of professional degree, the demographic groups most similar to Somalis are Barbadian (4.1%, a difference of 0.32%), Panamanian (4.1%, a difference of 0.35%), Yugoslavian (4.1%, a difference of 0.42%), Subsaharan African (4.1%, a difference of 0.66%), and Immigrants from Iraq (4.2%, a difference of 0.68%).
| Demographics | Rating | Rank | Professional Degree |
| Immigrants | Middle Africa | 22.1 /100 | #198 | Fair 4.2% |
| Norwegians | 20.5 /100 | #199 | Fair 4.2% |
| Immigrants | North Macedonia | 20.2 /100 | #200 | Fair 4.2% |
| Finns | 18.7 /100 | #201 | Poor 4.2% |
| Immigrants | Iraq | 17.1 /100 | #202 | Poor 4.2% |
| Panamanians | 15.9 /100 | #203 | Poor 4.1% |
| Barbadians | 15.8 /100 | #204 | Poor 4.1% |
| Somalis | 14.8 /100 | #205 | Poor 4.1% |
| Yugoslavians | 13.4 /100 | #206 | Poor 4.1% |
| Sub-Saharan Africans | 12.8 /100 | #207 | Poor 4.1% |
| Immigrants | Somalia | 12.5 /100 | #208 | Poor 4.1% |
| Immigrants | Panama | 12.3 /100 | #209 | Poor 4.1% |
| Immigrants | Nigeria | 11.7 /100 | #210 | Poor 4.1% |
| Germans | 11.6 /100 | #211 | Poor 4.1% |
| Whites/Caucasians | 11.2 /100 | #212 | Poor 4.1% |
Demographics Similar to Immigrants from Europe by Professional Degree
In terms of professional degree, the demographic groups most similar to Immigrants from Europe are Bolivian (5.6%, a difference of 0.42%), Bulgarian (5.7%, a difference of 0.52%), Immigrants from Lithuania (5.6%, a difference of 1.1%), South African (5.7%, a difference of 1.1%), and Immigrants from Malaysia (5.7%, a difference of 1.4%).
| Demographics | Rating | Rank | Professional Degree |
| Immigrants | Serbia | 100.0 /100 | #52 | Exceptional 5.8% |
| Immigrants | Netherlands | 100.0 /100 | #53 | Exceptional 5.8% |
| Immigrants | Kuwait | 100.0 /100 | #54 | Exceptional 5.7% |
| Immigrants | Western Europe | 100.0 /100 | #55 | Exceptional 5.7% |
| Immigrants | Malaysia | 100.0 /100 | #56 | Exceptional 5.7% |
| South Africans | 100.0 /100 | #57 | Exceptional 5.7% |
| Bulgarians | 100.0 /100 | #58 | Exceptional 5.7% |
| Immigrants | Europe | 100.0 /100 | #59 | Exceptional 5.6% |
| Bolivians | 99.9 /100 | #60 | Exceptional 5.6% |
| Immigrants | Lithuania | 99.9 /100 | #61 | Exceptional 5.6% |
| Immigrants | Belarus | 99.9 /100 | #62 | Exceptional 5.5% |
| Asians | 99.9 /100 | #63 | Exceptional 5.5% |
| Immigrants | Asia | 99.9 /100 | #64 | Exceptional 5.5% |
| Immigrants | Bolivia | 99.9 /100 | #65 | Exceptional 5.5% |
| Immigrants | Kazakhstan | 99.9 /100 | #66 | Exceptional 5.5% |