Somali vs Guyanese Professional Degree
COMPARE
Somali
Guyanese
Professional Degree
Professional Degree Comparison
Somalis
Guyanese
4.1%
PROFESSIONAL DEGREE
14.8/ 100
METRIC RATING
205th/ 347
METRIC RANK
3.8%
PROFESSIONAL DEGREE
1.6/ 100
METRIC RATING
247th/ 347
METRIC RANK
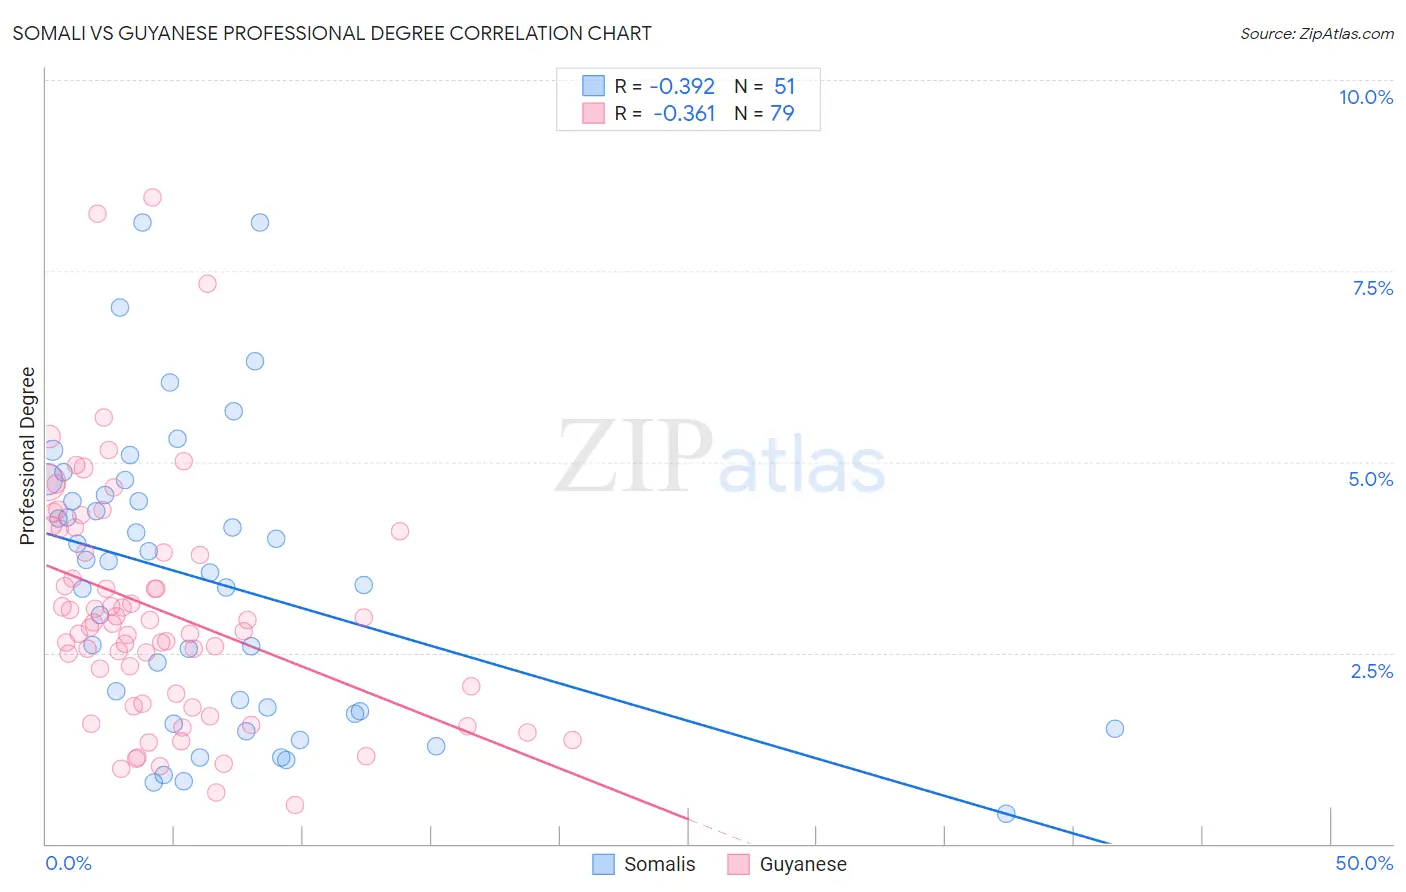
Somali vs Guyanese Professional Degree Correlation Chart
The statistical analysis conducted on geographies consisting of 99,274,303 people shows a mild negative correlation between the proportion of Somalis and percentage of population with at least professional degree education in the United States with a correlation coefficient (R) of -0.392 and weighted average of 4.1%. Similarly, the statistical analysis conducted on geographies consisting of 176,751,044 people shows a mild negative correlation between the proportion of Guyanese and percentage of population with at least professional degree education in the United States with a correlation coefficient (R) of -0.361 and weighted average of 3.8%, a difference of 10.0%.
Professional Degree Correlation Summary
| Measurement | Somali | Guyanese |
| Minimum | 0.40% | 0.51% |
| Maximum | 8.1% | 8.5% |
| Range | 7.7% | 8.0% |
| Mean | 3.4% | 3.1% |
| Median | 3.5% | 2.9% |
| Interquartile 25% (IQ1) | 1.7% | 1.8% |
| Interquartile 75% (IQ3) | 4.6% | 4.1% |
| Interquartile Range (IQR) | 2.9% | 2.3% |
| Standard Deviation (Sample) | 1.9% | 1.6% |
| Standard Deviation (Population) | 1.9% | 1.6% |
Similar Demographics by Professional Degree
Demographics Similar to Somalis by Professional Degree
In terms of professional degree, the demographic groups most similar to Somalis are Barbadian (4.1%, a difference of 0.32%), Panamanian (4.1%, a difference of 0.35%), Yugoslavian (4.1%, a difference of 0.42%), Subsaharan African (4.1%, a difference of 0.66%), and Immigrants from Iraq (4.2%, a difference of 0.68%).
| Demographics | Rating | Rank | Professional Degree |
| Immigrants | Middle Africa | 22.1 /100 | #198 | Fair 4.2% |
| Norwegians | 20.5 /100 | #199 | Fair 4.2% |
| Immigrants | North Macedonia | 20.2 /100 | #200 | Fair 4.2% |
| Finns | 18.7 /100 | #201 | Poor 4.2% |
| Immigrants | Iraq | 17.1 /100 | #202 | Poor 4.2% |
| Panamanians | 15.9 /100 | #203 | Poor 4.1% |
| Barbadians | 15.8 /100 | #204 | Poor 4.1% |
| Somalis | 14.8 /100 | #205 | Poor 4.1% |
| Yugoslavians | 13.4 /100 | #206 | Poor 4.1% |
| Sub-Saharan Africans | 12.8 /100 | #207 | Poor 4.1% |
| Immigrants | Somalia | 12.5 /100 | #208 | Poor 4.1% |
| Immigrants | Panama | 12.3 /100 | #209 | Poor 4.1% |
| Immigrants | Nigeria | 11.7 /100 | #210 | Poor 4.1% |
| Germans | 11.6 /100 | #211 | Poor 4.1% |
| Whites/Caucasians | 11.2 /100 | #212 | Poor 4.1% |
Demographics Similar to Guyanese by Professional Degree
In terms of professional degree, the demographic groups most similar to Guyanese are Marshallese (3.8%, a difference of 0.020%), Hmong (3.7%, a difference of 0.16%), French American Indian (3.8%, a difference of 0.20%), Immigrants from Grenada (3.7%, a difference of 0.27%), and Immigrants from Fiji (3.7%, a difference of 0.34%).
| Demographics | Rating | Rank | Professional Degree |
| Immigrants | Ecuador | 2.3 /100 | #240 | Tragic 3.8% |
| Alaskan Athabascans | 2.3 /100 | #241 | Tragic 3.8% |
| Native Hawaiians | 2.3 /100 | #242 | Tragic 3.8% |
| Guamanians/Chamorros | 2.2 /100 | #243 | Tragic 3.8% |
| Immigrants | Bahamas | 2.0 /100 | #244 | Tragic 3.8% |
| French American Indians | 1.7 /100 | #245 | Tragic 3.8% |
| Marshallese | 1.7 /100 | #246 | Tragic 3.8% |
| Guyanese | 1.6 /100 | #247 | Tragic 3.8% |
| Hmong | 1.6 /100 | #248 | Tragic 3.7% |
| Immigrants | Grenada | 1.5 /100 | #249 | Tragic 3.7% |
| Immigrants | Fiji | 1.5 /100 | #250 | Tragic 3.7% |
| Immigrants | Nicaragua | 1.4 /100 | #251 | Tragic 3.7% |
| Jamaicans | 1.4 /100 | #252 | Tragic 3.7% |
| Pueblo | 1.4 /100 | #253 | Tragic 3.7% |
| Tongans | 1.3 /100 | #254 | Tragic 3.7% |