Somali vs Portuguese Professional Degree
COMPARE
Somali
Portuguese
Professional Degree
Professional Degree Comparison
Somalis
Portuguese
4.1%
PROFESSIONAL DEGREE
14.8/ 100
METRIC RATING
205th/ 347
METRIC RANK
4.1%
PROFESSIONAL DEGREE
10.5/ 100
METRIC RATING
215th/ 347
METRIC RANK
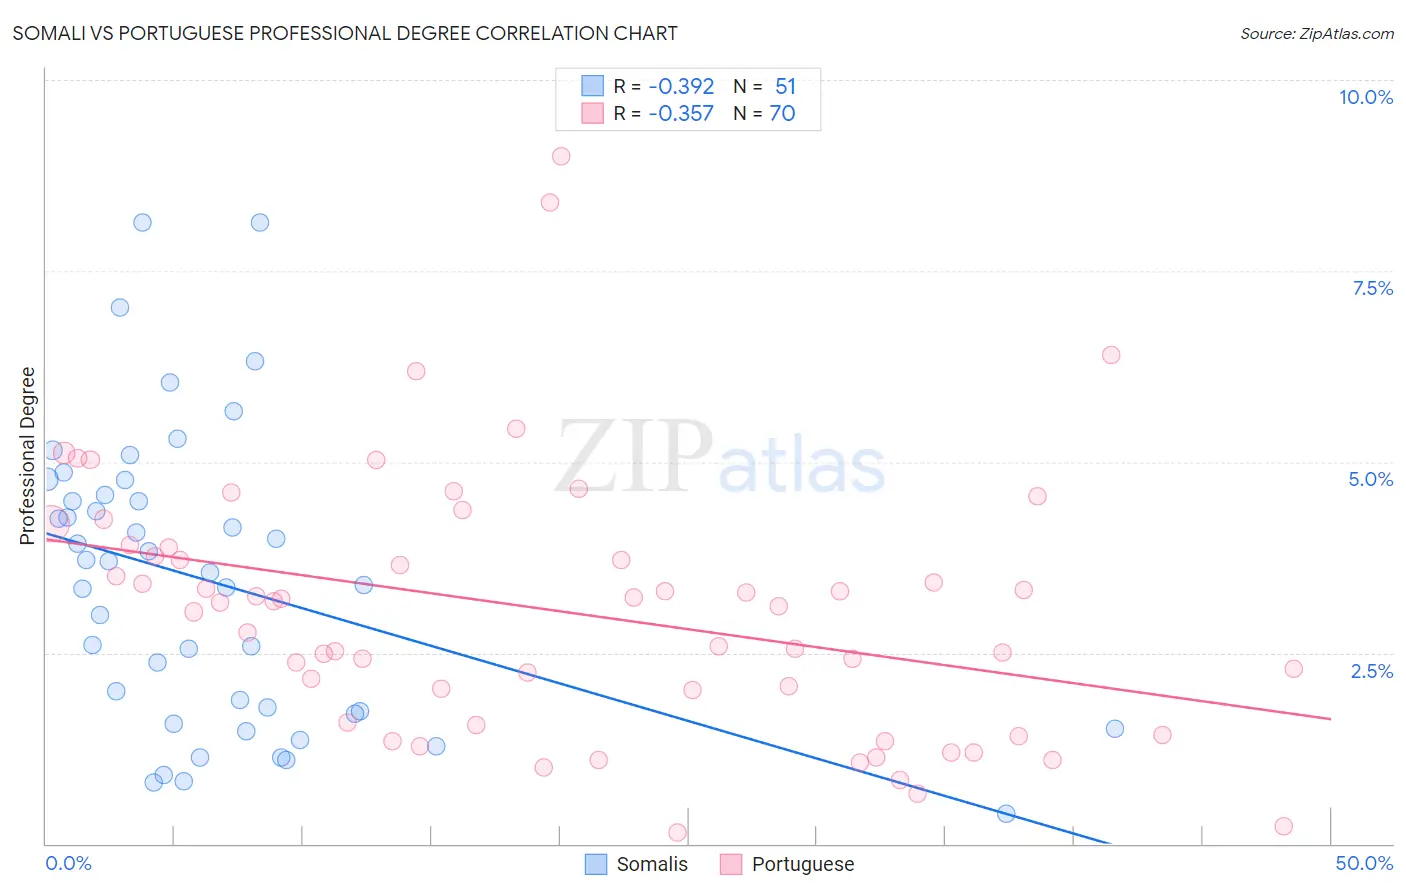
Somali vs Portuguese Professional Degree Correlation Chart
The statistical analysis conducted on geographies consisting of 99,274,303 people shows a mild negative correlation between the proportion of Somalis and percentage of population with at least professional degree education in the United States with a correlation coefficient (R) of -0.392 and weighted average of 4.1%. Similarly, the statistical analysis conducted on geographies consisting of 448,577,739 people shows a mild negative correlation between the proportion of Portuguese and percentage of population with at least professional degree education in the United States with a correlation coefficient (R) of -0.357 and weighted average of 4.1%, a difference of 1.5%.
Professional Degree Correlation Summary
| Measurement | Somali | Portuguese |
| Minimum | 0.40% | 0.14% |
| Maximum | 8.1% | 9.0% |
| Range | 7.7% | 8.9% |
| Mean | 3.4% | 3.1% |
| Median | 3.5% | 3.1% |
| Interquartile 25% (IQ1) | 1.7% | 1.6% |
| Interquartile 75% (IQ3) | 4.6% | 3.9% |
| Interquartile Range (IQR) | 2.9% | 2.3% |
| Standard Deviation (Sample) | 1.9% | 1.7% |
| Standard Deviation (Population) | 1.9% | 1.7% |
Demographics Similar to Somalis and Portuguese by Professional Degree
In terms of professional degree, the demographic groups most similar to Somalis are Barbadian (4.1%, a difference of 0.32%), Panamanian (4.1%, a difference of 0.35%), Yugoslavian (4.1%, a difference of 0.42%), Subsaharan African (4.1%, a difference of 0.66%), and Immigrants from Iraq (4.2%, a difference of 0.68%). Similarly, the demographic groups most similar to Portuguese are Immigrants from Ghana (4.1%, a difference of 0.050%), Korean (4.1%, a difference of 0.10%), White/Caucasian (4.1%, a difference of 0.28%), West Indian (4.1%, a difference of 0.31%), and German (4.1%, a difference of 0.46%).
| Demographics | Rating | Rank | Professional Degree |
| Immigrants | North Macedonia | 20.2 /100 | #200 | Fair 4.2% |
| Finns | 18.7 /100 | #201 | Poor 4.2% |
| Immigrants | Iraq | 17.1 /100 | #202 | Poor 4.2% |
| Panamanians | 15.9 /100 | #203 | Poor 4.1% |
| Barbadians | 15.8 /100 | #204 | Poor 4.1% |
| Somalis | 14.8 /100 | #205 | Poor 4.1% |
| Yugoslavians | 13.4 /100 | #206 | Poor 4.1% |
| Sub-Saharan Africans | 12.8 /100 | #207 | Poor 4.1% |
| Immigrants | Somalia | 12.5 /100 | #208 | Poor 4.1% |
| Immigrants | Panama | 12.3 /100 | #209 | Poor 4.1% |
| Immigrants | Nigeria | 11.7 /100 | #210 | Poor 4.1% |
| Germans | 11.6 /100 | #211 | Poor 4.1% |
| Whites/Caucasians | 11.2 /100 | #212 | Poor 4.1% |
| Koreans | 10.7 /100 | #213 | Poor 4.1% |
| Immigrants | Ghana | 10.6 /100 | #214 | Poor 4.1% |
| Portuguese | 10.5 /100 | #215 | Poor 4.1% |
| West Indians | 9.8 /100 | #216 | Tragic 4.1% |
| Immigrants | Vietnam | 9.4 /100 | #217 | Tragic 4.0% |
| Dutch | 9.0 /100 | #218 | Tragic 4.0% |
| Immigrants | South Eastern Asia | 8.9 /100 | #219 | Tragic 4.0% |
| Ute | 8.2 /100 | #220 | Tragic 4.0% |