Bermudan vs Immigrants from Europe Professional Degree
COMPARE
Bermudan
Immigrants from Europe
Professional Degree
Professional Degree Comparison
Bermudans
Immigrants from Europe
4.4%
PROFESSIONAL DEGREE
43.1/ 100
METRIC RATING
183rd/ 347
METRIC RANK
5.6%
PROFESSIONAL DEGREE
100.0/ 100
METRIC RATING
59th/ 347
METRIC RANK
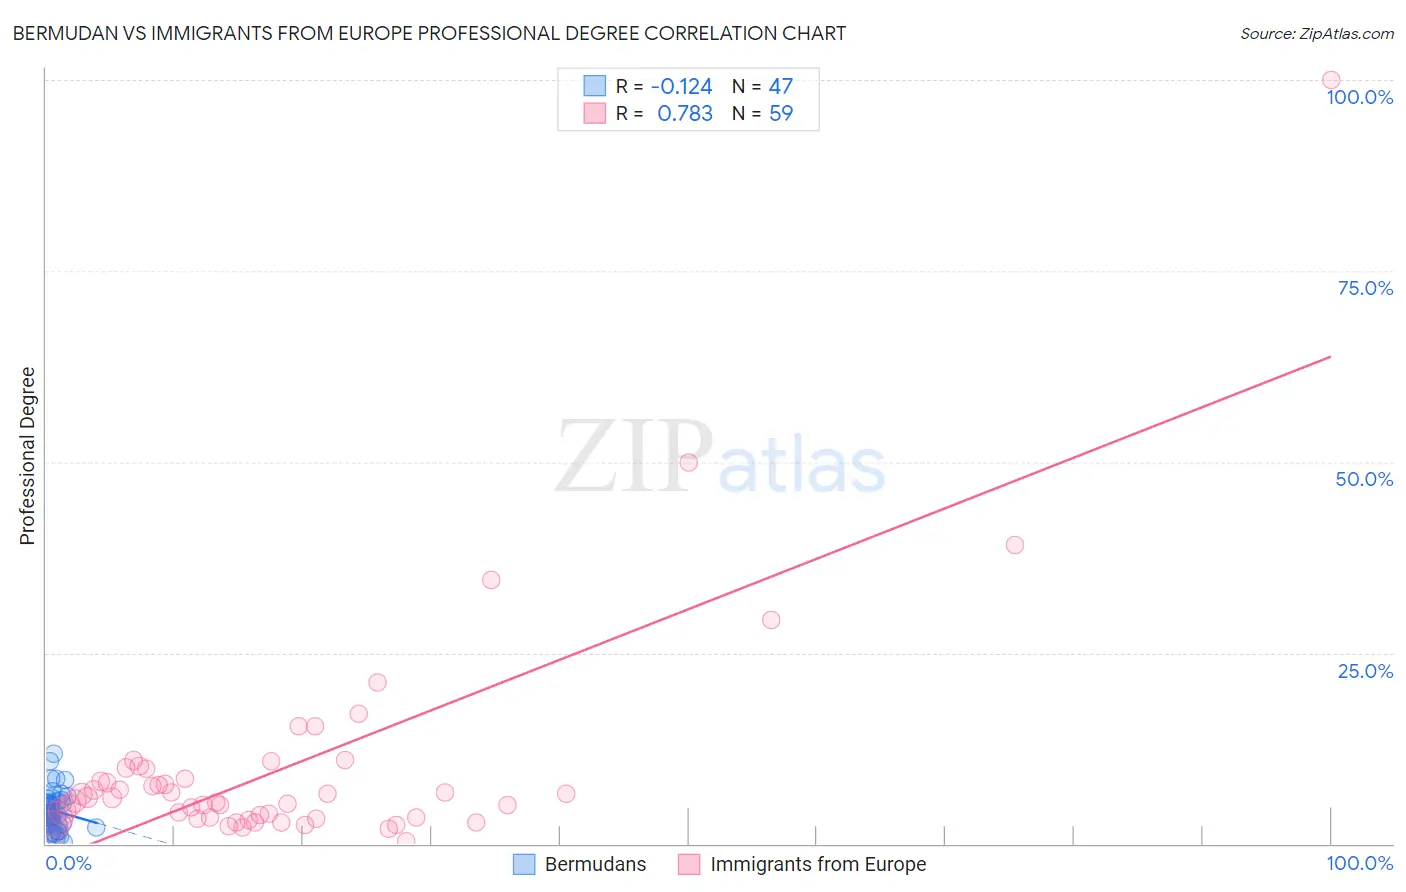
Bermudan vs Immigrants from Europe Professional Degree Correlation Chart
The statistical analysis conducted on geographies consisting of 55,708,616 people shows a poor negative correlation between the proportion of Bermudans and percentage of population with at least professional degree education in the United States with a correlation coefficient (R) of -0.124 and weighted average of 4.4%. Similarly, the statistical analysis conducted on geographies consisting of 543,310,657 people shows a strong positive correlation between the proportion of Immigrants from Europe and percentage of population with at least professional degree education in the United States with a correlation coefficient (R) of 0.783 and weighted average of 5.6%, a difference of 29.2%.
Professional Degree Correlation Summary
| Measurement | Bermudan | Immigrants from Europe |
| Minimum | 0.19% | 0.35% |
| Maximum | 11.8% | 100.0% |
| Range | 11.6% | 99.6% |
| Mean | 4.3% | 10.1% |
| Median | 4.0% | 6.0% |
| Interquartile 25% (IQ1) | 2.5% | 3.3% |
| Interquartile 75% (IQ3) | 5.6% | 9.9% |
| Interquartile Range (IQR) | 3.1% | 6.6% |
| Standard Deviation (Sample) | 2.5% | 15.1% |
| Standard Deviation (Population) | 2.5% | 14.9% |
Similar Demographics by Professional Degree
Demographics Similar to Bermudans by Professional Degree
In terms of professional degree, the demographic groups most similar to Bermudans are Immigrants (4.4%, a difference of 0.010%), Danish (4.4%, a difference of 0.060%), Czech (4.4%, a difference of 0.28%), Immigrants from Kenya (4.4%, a difference of 0.42%), and Immigrants from Costa Rica (4.4%, a difference of 0.53%).
| Demographics | Rating | Rank | Professional Degree |
| Immigrants | Peru | 49.3 /100 | #176 | Average 4.4% |
| Celtics | 47.6 /100 | #177 | Average 4.4% |
| Immigrants | Costa Rica | 46.7 /100 | #178 | Average 4.4% |
| Immigrants | Kenya | 45.9 /100 | #179 | Average 4.4% |
| Czechs | 44.9 /100 | #180 | Average 4.4% |
| Danes | 43.5 /100 | #181 | Average 4.4% |
| Immigrants | Immigrants | 43.2 /100 | #182 | Average 4.4% |
| Bermudans | 43.1 /100 | #183 | Average 4.4% |
| Belgians | 36.2 /100 | #184 | Fair 4.3% |
| Welsh | 35.8 /100 | #185 | Fair 4.3% |
| Scotch-Irish | 34.2 /100 | #186 | Fair 4.3% |
| Immigrants | Cameroon | 33.3 /100 | #187 | Fair 4.3% |
| Immigrants | Thailand | 31.7 /100 | #188 | Fair 4.3% |
| Slovaks | 30.7 /100 | #189 | Fair 4.3% |
| Immigrants | Poland | 29.2 /100 | #190 | Fair 4.3% |
Demographics Similar to Immigrants from Europe by Professional Degree
In terms of professional degree, the demographic groups most similar to Immigrants from Europe are Bolivian (5.6%, a difference of 0.42%), Bulgarian (5.7%, a difference of 0.52%), Immigrants from Lithuania (5.6%, a difference of 1.1%), South African (5.7%, a difference of 1.1%), and Immigrants from Malaysia (5.7%, a difference of 1.4%).
| Demographics | Rating | Rank | Professional Degree |
| Immigrants | Serbia | 100.0 /100 | #52 | Exceptional 5.8% |
| Immigrants | Netherlands | 100.0 /100 | #53 | Exceptional 5.8% |
| Immigrants | Kuwait | 100.0 /100 | #54 | Exceptional 5.7% |
| Immigrants | Western Europe | 100.0 /100 | #55 | Exceptional 5.7% |
| Immigrants | Malaysia | 100.0 /100 | #56 | Exceptional 5.7% |
| South Africans | 100.0 /100 | #57 | Exceptional 5.7% |
| Bulgarians | 100.0 /100 | #58 | Exceptional 5.7% |
| Immigrants | Europe | 100.0 /100 | #59 | Exceptional 5.6% |
| Bolivians | 99.9 /100 | #60 | Exceptional 5.6% |
| Immigrants | Lithuania | 99.9 /100 | #61 | Exceptional 5.6% |
| Immigrants | Belarus | 99.9 /100 | #62 | Exceptional 5.5% |
| Asians | 99.9 /100 | #63 | Exceptional 5.5% |
| Immigrants | Asia | 99.9 /100 | #64 | Exceptional 5.5% |
| Immigrants | Bolivia | 99.9 /100 | #65 | Exceptional 5.5% |
| Immigrants | Kazakhstan | 99.9 /100 | #66 | Exceptional 5.5% |