Somali vs Scotch-Irish Professional Degree
COMPARE
Somali
Scotch-Irish
Professional Degree
Professional Degree Comparison
Somalis
Scotch-Irish
4.1%
PROFESSIONAL DEGREE
14.8/ 100
METRIC RATING
205th/ 347
METRIC RANK
4.3%
PROFESSIONAL DEGREE
34.2/ 100
METRIC RATING
186th/ 347
METRIC RANK
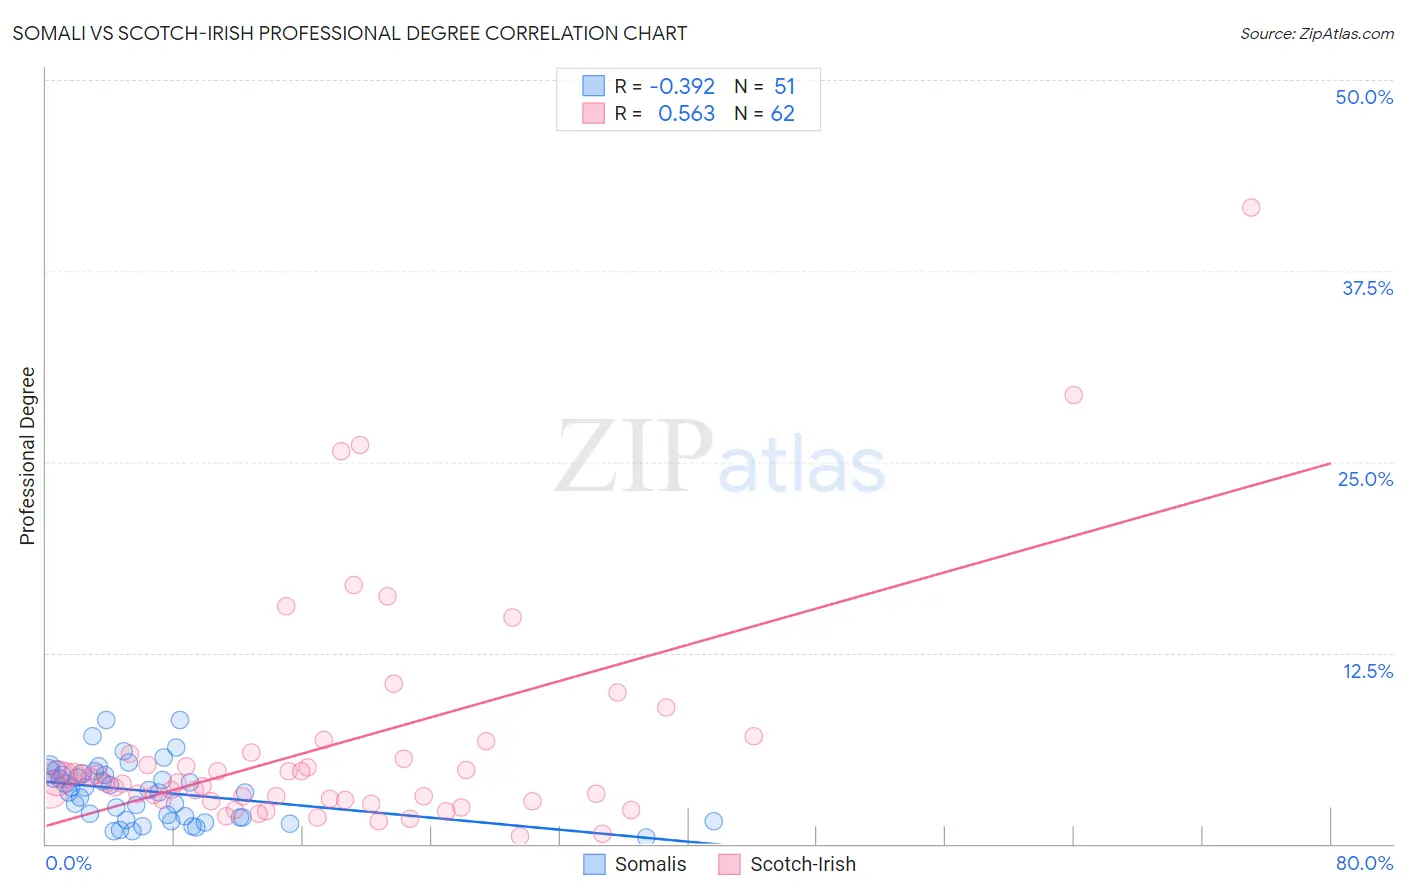
Somali vs Scotch-Irish Professional Degree Correlation Chart
The statistical analysis conducted on geographies consisting of 99,274,303 people shows a mild negative correlation between the proportion of Somalis and percentage of population with at least professional degree education in the United States with a correlation coefficient (R) of -0.392 and weighted average of 4.1%. Similarly, the statistical analysis conducted on geographies consisting of 542,187,635 people shows a substantial positive correlation between the proportion of Scotch-Irish and percentage of population with at least professional degree education in the United States with a correlation coefficient (R) of 0.563 and weighted average of 4.3%, a difference of 4.3%.
Professional Degree Correlation Summary
| Measurement | Somali | Scotch-Irish |
| Minimum | 0.40% | 0.53% |
| Maximum | 8.1% | 41.7% |
| Range | 7.7% | 41.1% |
| Mean | 3.4% | 6.5% |
| Median | 3.5% | 4.0% |
| Interquartile 25% (IQ1) | 1.7% | 2.8% |
| Interquartile 75% (IQ3) | 4.6% | 5.9% |
| Interquartile Range (IQR) | 2.9% | 3.0% |
| Standard Deviation (Sample) | 1.9% | 7.5% |
| Standard Deviation (Population) | 1.9% | 7.4% |
Demographics Similar to Somalis and Scotch-Irish by Professional Degree
In terms of professional degree, the demographic groups most similar to Somalis are Barbadian (4.1%, a difference of 0.32%), Panamanian (4.1%, a difference of 0.35%), Immigrants from Iraq (4.2%, a difference of 0.68%), Finnish (4.2%, a difference of 1.1%), and Immigrants from North Macedonia (4.2%, a difference of 1.5%). Similarly, the demographic groups most similar to Scotch-Irish are Immigrants from Cameroon (4.3%, a difference of 0.15%), Welsh (4.3%, a difference of 0.27%), Immigrants from Thailand (4.3%, a difference of 0.43%), Slovak (4.3%, a difference of 0.60%), and Immigrants from Poland (4.3%, a difference of 0.86%).
| Demographics | Rating | Rank | Professional Degree |
| Welsh | 35.8 /100 | #185 | Fair 4.3% |
| Scotch-Irish | 34.2 /100 | #186 | Fair 4.3% |
| Immigrants | Cameroon | 33.3 /100 | #187 | Fair 4.3% |
| Immigrants | Thailand | 31.7 /100 | #188 | Fair 4.3% |
| Slovaks | 30.7 /100 | #189 | Fair 4.3% |
| Immigrants | Poland | 29.2 /100 | #190 | Fair 4.3% |
| Sri Lankans | 29.0 /100 | #191 | Fair 4.3% |
| Ghanaians | 27.3 /100 | #192 | Fair 4.3% |
| French | 27.1 /100 | #193 | Fair 4.2% |
| Scandinavians | 25.8 /100 | #194 | Fair 4.2% |
| Nigerians | 24.6 /100 | #195 | Fair 4.2% |
| Spanish | 23.0 /100 | #196 | Fair 4.2% |
| Czechoslovakians | 22.4 /100 | #197 | Fair 4.2% |
| Immigrants | Middle Africa | 22.1 /100 | #198 | Fair 4.2% |
| Norwegians | 20.5 /100 | #199 | Fair 4.2% |
| Immigrants | North Macedonia | 20.2 /100 | #200 | Fair 4.2% |
| Finns | 18.7 /100 | #201 | Poor 4.2% |
| Immigrants | Iraq | 17.1 /100 | #202 | Poor 4.2% |
| Panamanians | 15.9 /100 | #203 | Poor 4.1% |
| Barbadians | 15.8 /100 | #204 | Poor 4.1% |
| Somalis | 14.8 /100 | #205 | Poor 4.1% |