Arab vs Immigrants from Europe Professional Degree
COMPARE
Arab
Immigrants from Europe
Professional Degree
Professional Degree Comparison
Arabs
Immigrants from Europe
5.0%
PROFESSIONAL DEGREE
98.2/ 100
METRIC RATING
104th/ 347
METRIC RANK
5.6%
PROFESSIONAL DEGREE
100.0/ 100
METRIC RATING
59th/ 347
METRIC RANK
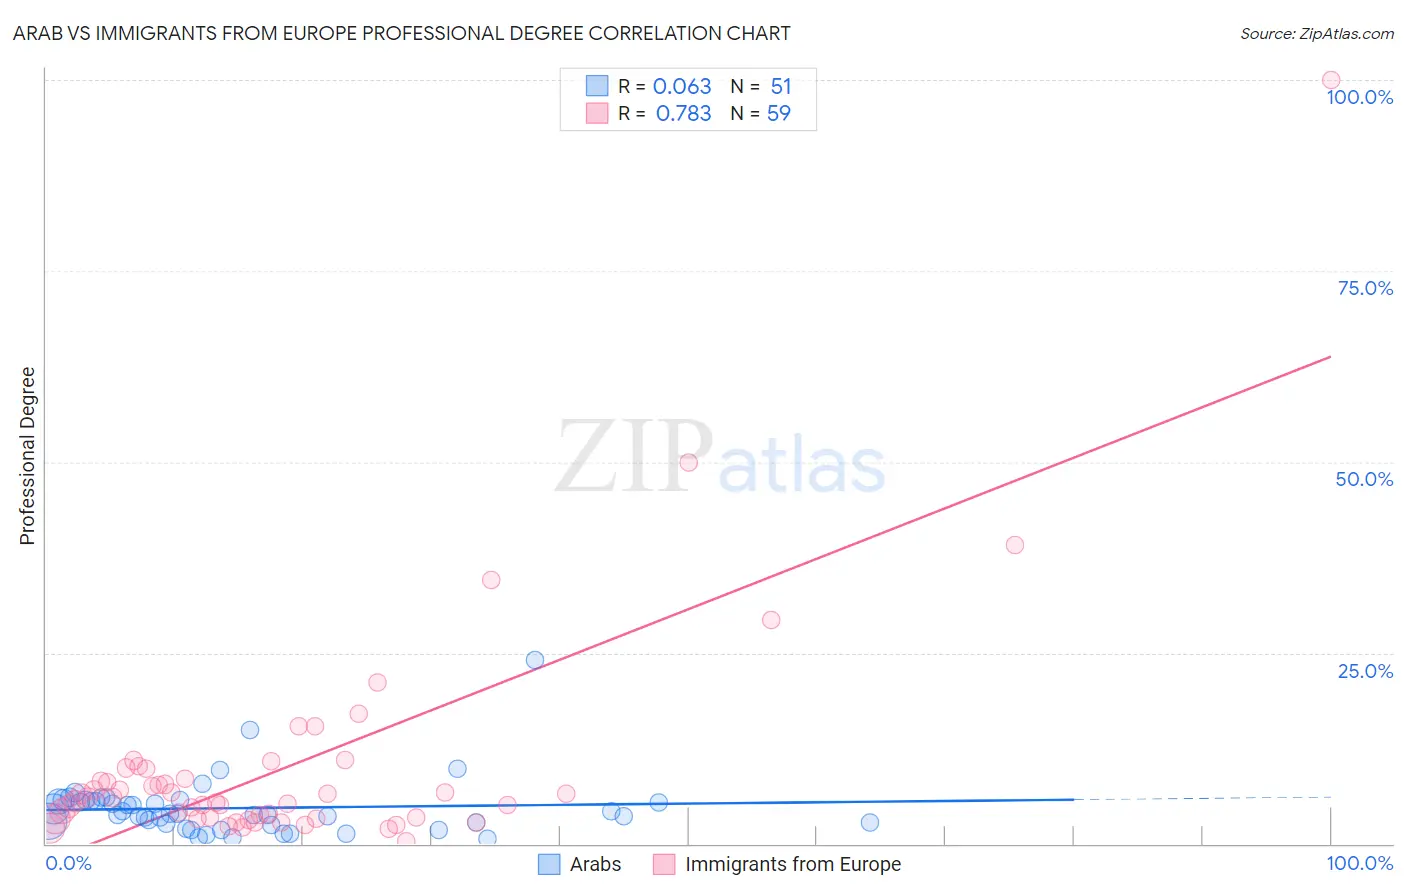
Arab vs Immigrants from Europe Professional Degree Correlation Chart
The statistical analysis conducted on geographies consisting of 485,125,544 people shows a slight positive correlation between the proportion of Arabs and percentage of population with at least professional degree education in the United States with a correlation coefficient (R) of 0.063 and weighted average of 5.0%. Similarly, the statistical analysis conducted on geographies consisting of 543,310,657 people shows a strong positive correlation between the proportion of Immigrants from Europe and percentage of population with at least professional degree education in the United States with a correlation coefficient (R) of 0.783 and weighted average of 5.6%, a difference of 11.7%.
Professional Degree Correlation Summary
| Measurement | Arab | Immigrants from Europe |
| Minimum | 0.70% | 0.35% |
| Maximum | 24.1% | 100.0% |
| Range | 23.4% | 99.6% |
| Mean | 4.7% | 10.1% |
| Median | 3.9% | 6.0% |
| Interquartile 25% (IQ1) | 2.6% | 3.3% |
| Interquartile 75% (IQ3) | 5.6% | 9.9% |
| Interquartile Range (IQR) | 3.0% | 6.6% |
| Standard Deviation (Sample) | 3.8% | 15.1% |
| Standard Deviation (Population) | 3.7% | 14.9% |
Similar Demographics by Professional Degree
Demographics Similar to Arabs by Professional Degree
In terms of professional degree, the demographic groups most similar to Arabs are Immigrants from Uganda (5.0%, a difference of 0.020%), Immigrants from Ukraine (5.0%, a difference of 0.050%), Maltese (5.0%, a difference of 0.17%), Immigrants from Southern Europe (5.0%, a difference of 0.21%), and British (5.0%, a difference of 0.23%).
| Demographics | Rating | Rank | Professional Degree |
| Syrians | 99.1 /100 | #97 | Exceptional 5.2% |
| Austrians | 99.1 /100 | #98 | Exceptional 5.2% |
| Immigrants | Italy | 99.1 /100 | #99 | Exceptional 5.2% |
| Ugandans | 98.8 /100 | #100 | Exceptional 5.1% |
| Immigrants | Egypt | 98.5 /100 | #101 | Exceptional 5.1% |
| Ukrainians | 98.5 /100 | #102 | Exceptional 5.1% |
| Immigrants | Northern Africa | 98.4 /100 | #103 | Exceptional 5.1% |
| Arabs | 98.2 /100 | #104 | Exceptional 5.0% |
| Immigrants | Uganda | 98.2 /100 | #105 | Exceptional 5.0% |
| Immigrants | Ukraine | 98.2 /100 | #106 | Exceptional 5.0% |
| Maltese | 98.1 /100 | #107 | Exceptional 5.0% |
| Immigrants | Southern Europe | 98.1 /100 | #108 | Exceptional 5.0% |
| British | 98.0 /100 | #109 | Exceptional 5.0% |
| Lebanese | 98.0 /100 | #110 | Exceptional 5.0% |
| Brazilians | 97.4 /100 | #111 | Exceptional 5.0% |
Demographics Similar to Immigrants from Europe by Professional Degree
In terms of professional degree, the demographic groups most similar to Immigrants from Europe are Bolivian (5.6%, a difference of 0.42%), Bulgarian (5.7%, a difference of 0.52%), Immigrants from Lithuania (5.6%, a difference of 1.1%), South African (5.7%, a difference of 1.1%), and Immigrants from Malaysia (5.7%, a difference of 1.4%).
| Demographics | Rating | Rank | Professional Degree |
| Immigrants | Serbia | 100.0 /100 | #52 | Exceptional 5.8% |
| Immigrants | Netherlands | 100.0 /100 | #53 | Exceptional 5.8% |
| Immigrants | Kuwait | 100.0 /100 | #54 | Exceptional 5.7% |
| Immigrants | Western Europe | 100.0 /100 | #55 | Exceptional 5.7% |
| Immigrants | Malaysia | 100.0 /100 | #56 | Exceptional 5.7% |
| South Africans | 100.0 /100 | #57 | Exceptional 5.7% |
| Bulgarians | 100.0 /100 | #58 | Exceptional 5.7% |
| Immigrants | Europe | 100.0 /100 | #59 | Exceptional 5.6% |
| Bolivians | 99.9 /100 | #60 | Exceptional 5.6% |
| Immigrants | Lithuania | 99.9 /100 | #61 | Exceptional 5.6% |
| Immigrants | Belarus | 99.9 /100 | #62 | Exceptional 5.5% |
| Asians | 99.9 /100 | #63 | Exceptional 5.5% |
| Immigrants | Asia | 99.9 /100 | #64 | Exceptional 5.5% |
| Immigrants | Bolivia | 99.9 /100 | #65 | Exceptional 5.5% |
| Immigrants | Kazakhstan | 99.9 /100 | #66 | Exceptional 5.5% |