Immigrants from Ethiopia vs Immigrants from Austria No Schooling Completed
COMPARE
Immigrants from Ethiopia
Immigrants from Austria
No Schooling Completed
No Schooling Completed Comparison
Immigrants from Ethiopia
Immigrants from Austria
2.5%
NO SCHOOLING COMPLETED
0.6/ 100
METRIC RATING
260th/ 347
METRIC RANK
1.7%
NO SCHOOLING COMPLETED
99.7/ 100
METRIC RATING
67th/ 347
METRIC RANK
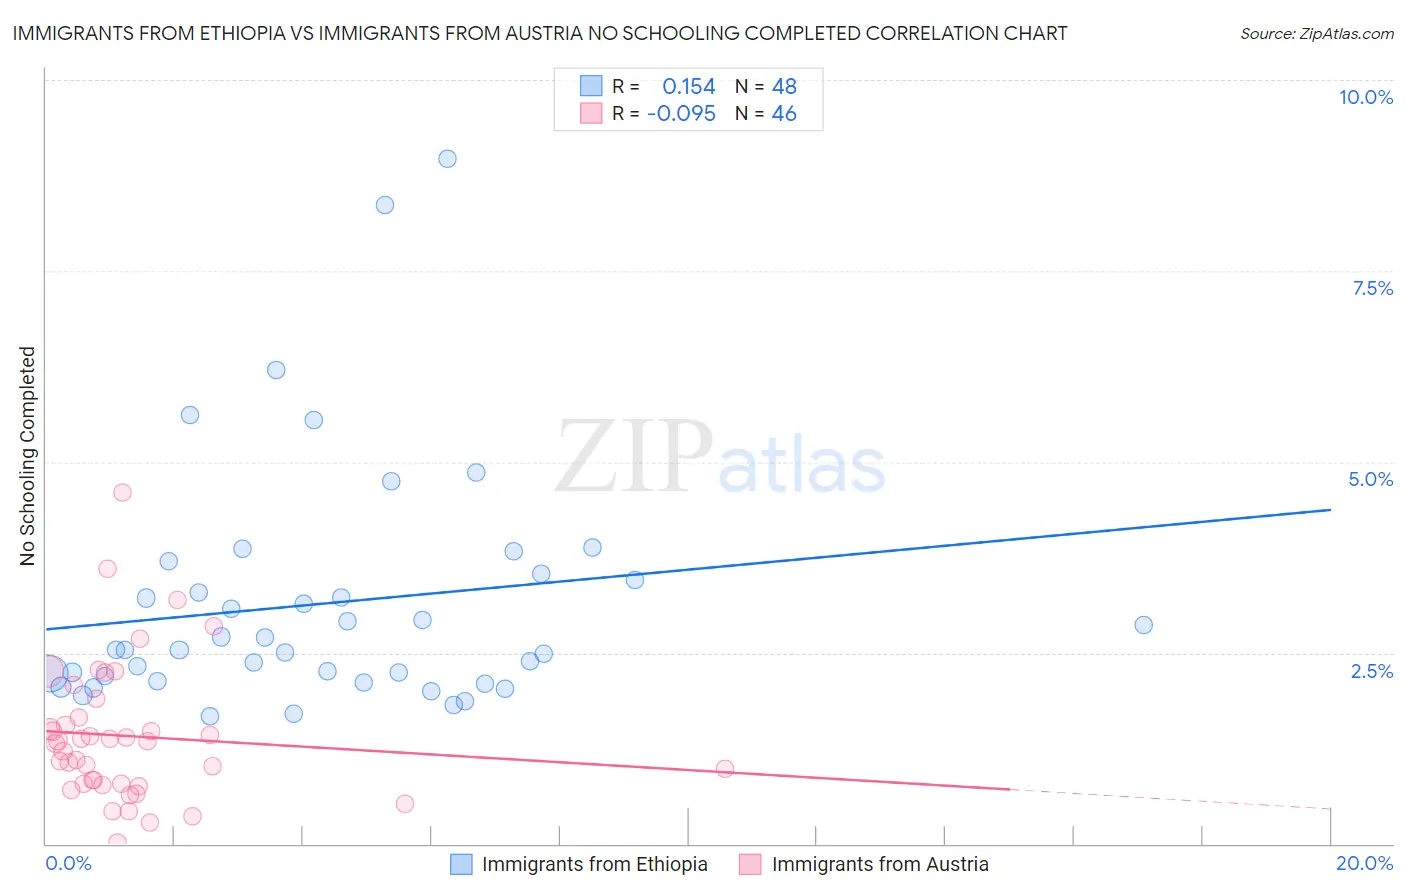
Immigrants from Ethiopia vs Immigrants from Austria No Schooling Completed Correlation Chart
The statistical analysis conducted on geographies consisting of 210,607,771 people shows a poor positive correlation between the proportion of Immigrants from Ethiopia and percentage of population with no schooling in the United States with a correlation coefficient (R) of 0.154 and weighted average of 2.5%. Similarly, the statistical analysis conducted on geographies consisting of 166,939,522 people shows a slight negative correlation between the proportion of Immigrants from Austria and percentage of population with no schooling in the United States with a correlation coefficient (R) of -0.095 and weighted average of 1.7%, a difference of 46.4%.
No Schooling Completed Correlation Summary
| Measurement | Immigrants from Ethiopia | Immigrants from Austria |
| Minimum | 1.7% | 0.024% |
| Maximum | 9.0% | 4.6% |
| Range | 7.3% | 4.6% |
| Mean | 3.1% | 1.4% |
| Median | 2.5% | 1.3% |
| Interquartile 25% (IQ1) | 2.2% | 0.78% |
| Interquartile 75% (IQ3) | 3.5% | 1.7% |
| Interquartile Range (IQR) | 1.3% | 0.87% |
| Standard Deviation (Sample) | 1.6% | 0.91% |
| Standard Deviation (Population) | 1.6% | 0.90% |
Similar Demographics by No Schooling Completed
Demographics Similar to Immigrants from Ethiopia by No Schooling Completed
In terms of no schooling completed, the demographic groups most similar to Immigrants from Ethiopia are Immigrants from Jamaica (2.5%, a difference of 0.050%), Assyrian/Chaldean/Syriac (2.5%, a difference of 0.11%), Armenian (2.5%, a difference of 0.13%), Immigrants from South America (2.5%, a difference of 0.14%), and Immigrants from Sierra Leone (2.5%, a difference of 0.48%).
| Demographics | Rating | Rank | No Schooling Completed |
| Immigrants | Asia | 0.9 /100 | #253 | Tragic 2.4% |
| Immigrants | Eastern Africa | 0.9 /100 | #254 | Tragic 2.4% |
| Ethiopians | 0.8 /100 | #255 | Tragic 2.4% |
| Yaqui | 0.8 /100 | #256 | Tragic 2.4% |
| Immigrants | South America | 0.6 /100 | #257 | Tragic 2.5% |
| Assyrians/Chaldeans/Syriacs | 0.6 /100 | #258 | Tragic 2.5% |
| Immigrants | Jamaica | 0.6 /100 | #259 | Tragic 2.5% |
| Immigrants | Ethiopia | 0.6 /100 | #260 | Tragic 2.5% |
| Armenians | 0.5 /100 | #261 | Tragic 2.5% |
| Immigrants | Sierra Leone | 0.5 /100 | #262 | Tragic 2.5% |
| Immigrants | Liberia | 0.4 /100 | #263 | Tragic 2.5% |
| Indians (Asian) | 0.4 /100 | #264 | Tragic 2.5% |
| West Indians | 0.4 /100 | #265 | Tragic 2.5% |
| Fijians | 0.4 /100 | #266 | Tragic 2.5% |
| Yuman | 0.4 /100 | #267 | Tragic 2.5% |
Demographics Similar to Immigrants from Austria by No Schooling Completed
In terms of no schooling completed, the demographic groups most similar to Immigrants from Austria are Canadian (1.7%, a difference of 0.19%), Serbian (1.7%, a difference of 0.33%), New Zealander (1.7%, a difference of 0.37%), Russian (1.7%, a difference of 0.53%), and Immigrants from Northern Europe (1.7%, a difference of 0.57%).
| Demographics | Rating | Rank | No Schooling Completed |
| Americans | 99.8 /100 | #60 | Exceptional 1.7% |
| Tsimshian | 99.8 /100 | #61 | Exceptional 1.7% |
| Immigrants | Northern Europe | 99.8 /100 | #62 | Exceptional 1.7% |
| Russians | 99.8 /100 | #63 | Exceptional 1.7% |
| New Zealanders | 99.7 /100 | #64 | Exceptional 1.7% |
| Serbians | 99.7 /100 | #65 | Exceptional 1.7% |
| Canadians | 99.7 /100 | #66 | Exceptional 1.7% |
| Immigrants | Austria | 99.7 /100 | #67 | Exceptional 1.7% |
| Immigrants | Lithuania | 99.7 /100 | #68 | Exceptional 1.7% |
| Chickasaw | 99.6 /100 | #69 | Exceptional 1.7% |
| Immigrants | Netherlands | 99.6 /100 | #70 | Exceptional 1.7% |
| Immigrants | England | 99.5 /100 | #71 | Exceptional 1.7% |
| Cajuns | 99.5 /100 | #72 | Exceptional 1.7% |
| Immigrants | India | 99.4 /100 | #73 | Exceptional 1.7% |
| Zimbabweans | 99.4 /100 | #74 | Exceptional 1.7% |