Serbian vs Dutch 9th Grade
COMPARE
Serbian
Dutch
9th Grade
9th Grade Comparison
Serbians
Dutch
96.0%
9TH GRADE
99.9/ 100
METRIC RATING
52nd/ 347
METRIC RANK
96.5%
9TH GRADE
100.0/ 100
METRIC RATING
17th/ 347
METRIC RANK
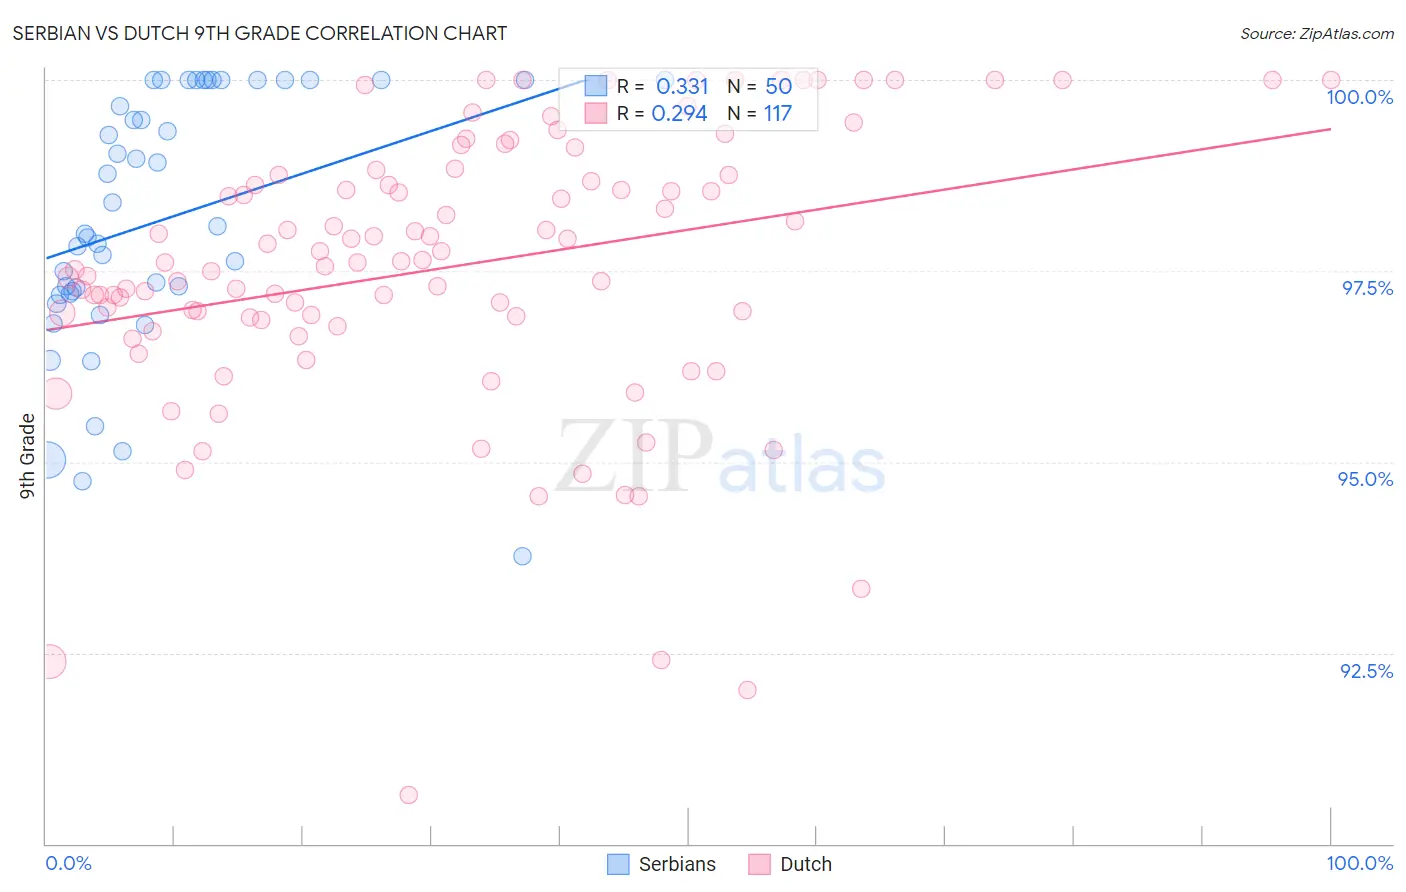
Serbian vs Dutch 9th Grade Correlation Chart
The statistical analysis conducted on geographies consisting of 267,641,806 people shows a mild positive correlation between the proportion of Serbians and percentage of population with at least 9th grade education in the United States with a correlation coefficient (R) of 0.331 and weighted average of 96.0%. Similarly, the statistical analysis conducted on geographies consisting of 554,359,196 people shows a weak positive correlation between the proportion of Dutch and percentage of population with at least 9th grade education in the United States with a correlation coefficient (R) of 0.294 and weighted average of 96.5%, a difference of 0.47%.
9th Grade Correlation Summary
| Measurement | Serbian | Dutch |
| Minimum | 93.8% | 90.6% |
| Maximum | 100.0% | 100.0% |
| Range | 6.2% | 9.4% |
| Mean | 98.2% | 97.5% |
| Median | 98.0% | 97.6% |
| Interquartile 25% (IQ1) | 97.2% | 96.9% |
| Interquartile 75% (IQ3) | 100.0% | 98.8% |
| Interquartile Range (IQR) | 2.8% | 1.9% |
| Standard Deviation (Sample) | 1.7% | 1.8% |
| Standard Deviation (Population) | 1.6% | 1.8% |
Similar Demographics by 9th Grade
Demographics Similar to Serbians by 9th Grade
In terms of 9th grade, the demographic groups most similar to Serbians are Immigrants from Northern Europe (96.0%, a difference of 0.0%), Austrian (96.0%, a difference of 0.010%), Celtic (96.0%, a difference of 0.020%), Immigrants from Canada (96.0%, a difference of 0.020%), and Greek (96.0%, a difference of 0.030%).
| Demographics | Rating | Rank | 9th Grade |
| Crow | 99.9 /100 | #45 | Exceptional 96.1% |
| Immigrants | India | 99.9 /100 | #46 | Exceptional 96.1% |
| Russians | 99.9 /100 | #47 | Exceptional 96.0% |
| Australians | 99.9 /100 | #48 | Exceptional 96.0% |
| Greeks | 99.9 /100 | #49 | Exceptional 96.0% |
| Celtics | 99.9 /100 | #50 | Exceptional 96.0% |
| Immigrants | Northern Europe | 99.9 /100 | #51 | Exceptional 96.0% |
| Serbians | 99.9 /100 | #52 | Exceptional 96.0% |
| Austrians | 99.8 /100 | #53 | Exceptional 96.0% |
| Immigrants | Canada | 99.8 /100 | #54 | Exceptional 96.0% |
| Immigrants | Austria | 99.8 /100 | #55 | Exceptional 96.0% |
| Immigrants | North America | 99.8 /100 | #56 | Exceptional 96.0% |
| Macedonians | 99.8 /100 | #57 | Exceptional 96.0% |
| Aleuts | 99.8 /100 | #58 | Exceptional 96.0% |
| New Zealanders | 99.8 /100 | #59 | Exceptional 95.9% |
Demographics Similar to Dutch by 9th Grade
In terms of 9th grade, the demographic groups most similar to Dutch are Scandinavian (96.5%, a difference of 0.020%), Welsh (96.4%, a difference of 0.050%), Irish (96.5%, a difference of 0.060%), Croatian (96.5%, a difference of 0.060%), and Italian (96.4%, a difference of 0.060%).
| Demographics | Rating | Rank | 9th Grade |
| Lithuanians | 100.0 /100 | #10 | Exceptional 96.6% |
| Finns | 100.0 /100 | #11 | Exceptional 96.6% |
| English | 100.0 /100 | #12 | Exceptional 96.6% |
| Danes | 100.0 /100 | #13 | Exceptional 96.5% |
| Scottish | 100.0 /100 | #14 | Exceptional 96.5% |
| Irish | 100.0 /100 | #15 | Exceptional 96.5% |
| Croatians | 100.0 /100 | #16 | Exceptional 96.5% |
| Dutch | 100.0 /100 | #17 | Exceptional 96.5% |
| Scandinavians | 100.0 /100 | #18 | Exceptional 96.5% |
| Welsh | 100.0 /100 | #19 | Exceptional 96.4% |
| Italians | 100.0 /100 | #20 | Exceptional 96.4% |
| Alaskan Athabascans | 100.0 /100 | #21 | Exceptional 96.4% |
| Europeans | 100.0 /100 | #22 | Exceptional 96.4% |
| Czechs | 100.0 /100 | #23 | Exceptional 96.4% |
| Latvians | 100.0 /100 | #24 | Exceptional 96.4% |