New Zealander vs Alaskan Athabascan High School Diploma
COMPARE
New Zealander
Alaskan Athabascan
High School Diploma
High School Diploma Comparison
New Zealanders
Alaskan Athabascans
91.1%
HIGH SCHOOL DIPLOMA
99.7/ 100
METRIC RATING
51st/ 347
METRIC RANK
90.9%
HIGH SCHOOL DIPLOMA
99.4/ 100
METRIC RATING
71st/ 347
METRIC RANK
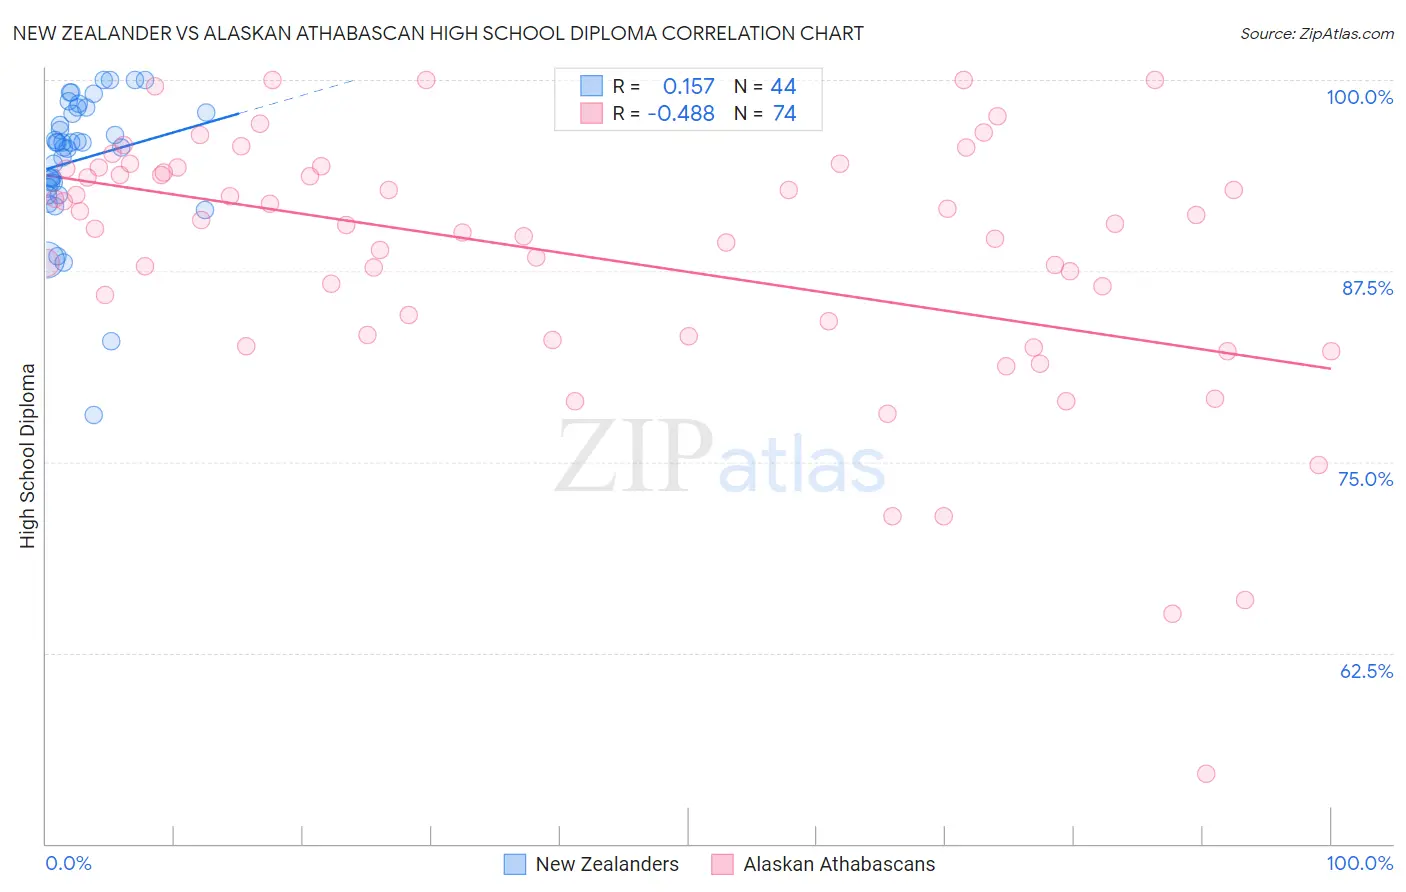
New Zealander vs Alaskan Athabascan High School Diploma Correlation Chart
The statistical analysis conducted on geographies consisting of 106,912,544 people shows a poor positive correlation between the proportion of New Zealanders and percentage of population with at least high school diploma education in the United States with a correlation coefficient (R) of 0.157 and weighted average of 91.1%. Similarly, the statistical analysis conducted on geographies consisting of 45,820,221 people shows a moderate negative correlation between the proportion of Alaskan Athabascans and percentage of population with at least high school diploma education in the United States with a correlation coefficient (R) of -0.488 and weighted average of 90.9%, a difference of 0.27%.
High School Diploma Correlation Summary
| Measurement | New Zealander | Alaskan Athabascan |
| Minimum | 78.1% | 54.5% |
| Maximum | 100.0% | 100.0% |
| Range | 21.9% | 45.5% |
| Mean | 94.8% | 88.4% |
| Median | 95.9% | 90.5% |
| Interquartile 25% (IQ1) | 93.1% | 83.3% |
| Interquartile 75% (IQ3) | 98.0% | 94.2% |
| Interquartile Range (IQR) | 4.9% | 10.9% |
| Standard Deviation (Sample) | 4.5% | 8.6% |
| Standard Deviation (Population) | 4.4% | 8.5% |
Demographics Similar to New Zealanders and Alaskan Athabascans by High School Diploma
In terms of high school diploma, the demographic groups most similar to New Zealanders are Immigrants from Sweden (91.1%, a difference of 0.0%), Immigrants from Belgium (91.1%, a difference of 0.0%), Macedonian (91.1%, a difference of 0.020%), Serbian (91.1%, a difference of 0.040%), and Immigrants from Canada (91.1%, a difference of 0.070%). Similarly, the demographic groups most similar to Alaskan Athabascans are Immigrants from Latvia (90.9%, a difference of 0.0%), French Canadian (90.9%, a difference of 0.010%), Czechoslovakian (90.9%, a difference of 0.040%), Immigrants from Iran (90.9%, a difference of 0.050%), and French (91.0%, a difference of 0.070%).
| Demographics | Rating | Rank | High School Diploma |
| New Zealanders | 99.7 /100 | #51 | Exceptional 91.1% |
| Immigrants | Sweden | 99.7 /100 | #52 | Exceptional 91.1% |
| Immigrants | Belgium | 99.7 /100 | #53 | Exceptional 91.1% |
| Macedonians | 99.7 /100 | #54 | Exceptional 91.1% |
| Serbians | 99.7 /100 | #55 | Exceptional 91.1% |
| Immigrants | Canada | 99.7 /100 | #56 | Exceptional 91.1% |
| Zimbabweans | 99.7 /100 | #57 | Exceptional 91.1% |
| Slavs | 99.7 /100 | #58 | Exceptional 91.0% |
| Immigrants | North America | 99.7 /100 | #59 | Exceptional 91.0% |
| Immigrants | Japan | 99.6 /100 | #60 | Exceptional 91.0% |
| Immigrants | Taiwan | 99.6 /100 | #61 | Exceptional 91.0% |
| Austrians | 99.6 /100 | #62 | Exceptional 91.0% |
| Immigrants | Netherlands | 99.6 /100 | #63 | Exceptional 91.0% |
| Ukrainians | 99.6 /100 | #64 | Exceptional 91.0% |
| Immigrants | South Africa | 99.6 /100 | #65 | Exceptional 91.0% |
| French | 99.5 /100 | #66 | Exceptional 91.0% |
| Immigrants | Iran | 99.5 /100 | #67 | Exceptional 90.9% |
| Czechoslovakians | 99.5 /100 | #68 | Exceptional 90.9% |
| French Canadians | 99.5 /100 | #69 | Exceptional 90.9% |
| Immigrants | Latvia | 99.5 /100 | #70 | Exceptional 90.9% |
| Alaskan Athabascans | 99.4 /100 | #71 | Exceptional 90.9% |