Cambodian vs West Indian Professional Degree
COMPARE
Cambodian
West Indian
Professional Degree
Professional Degree Comparison
Cambodians
West Indians
6.0%
PROFESSIONAL DEGREE
100.0/ 100
METRIC RATING
40th/ 347
METRIC RANK
4.1%
PROFESSIONAL DEGREE
9.8/ 100
METRIC RATING
216th/ 347
METRIC RANK
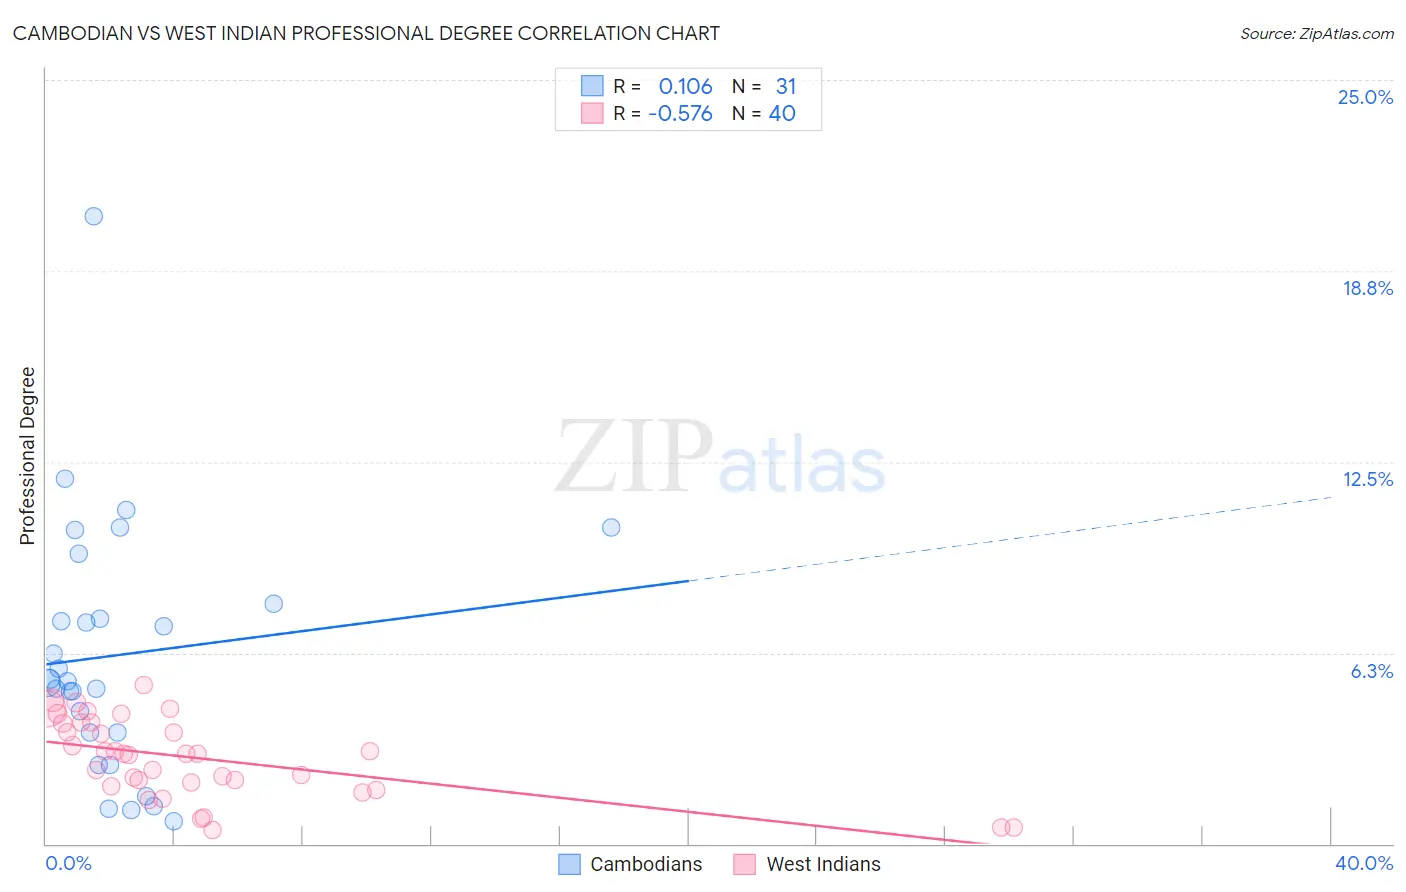
Cambodian vs West Indian Professional Degree Correlation Chart
The statistical analysis conducted on geographies consisting of 102,442,026 people shows a poor positive correlation between the proportion of Cambodians and percentage of population with at least professional degree education in the United States with a correlation coefficient (R) of 0.106 and weighted average of 6.0%. Similarly, the statistical analysis conducted on geographies consisting of 253,709,742 people shows a substantial negative correlation between the proportion of West Indians and percentage of population with at least professional degree education in the United States with a correlation coefficient (R) of -0.576 and weighted average of 4.1%, a difference of 47.3%.
Professional Degree Correlation Summary
| Measurement | Cambodian | West Indian |
| Minimum | 0.74% | 0.46% |
| Maximum | 20.5% | 5.2% |
| Range | 19.8% | 4.7% |
| Mean | 6.2% | 2.8% |
| Median | 5.3% | 2.9% |
| Interquartile 25% (IQ1) | 3.6% | 1.9% |
| Interquartile 75% (IQ3) | 7.9% | 3.9% |
| Interquartile Range (IQR) | 4.2% | 2.0% |
| Standard Deviation (Sample) | 4.1% | 1.3% |
| Standard Deviation (Population) | 4.0% | 1.3% |
Similar Demographics by Professional Degree
Demographics Similar to Cambodians by Professional Degree
In terms of professional degree, the demographic groups most similar to Cambodians are New Zealander (6.0%, a difference of 0.18%), Estonian (6.0%, a difference of 0.19%), Immigrants from South Africa (6.0%, a difference of 0.47%), Immigrants from Saudi Arabia (5.9%, a difference of 0.52%), and Argentinean (5.9%, a difference of 0.68%).
| Demographics | Rating | Rank | Professional Degree |
| Burmese | 100.0 /100 | #33 | Exceptional 6.1% |
| Mongolians | 100.0 /100 | #34 | Exceptional 6.1% |
| Immigrants | Korea | 100.0 /100 | #35 | Exceptional 6.1% |
| Immigrants | Russia | 100.0 /100 | #36 | Exceptional 6.0% |
| Immigrants | Austria | 100.0 /100 | #37 | Exceptional 6.0% |
| Immigrants | Norway | 100.0 /100 | #38 | Exceptional 6.0% |
| Immigrants | South Africa | 100.0 /100 | #39 | Exceptional 6.0% |
| Cambodians | 100.0 /100 | #40 | Exceptional 6.0% |
| New Zealanders | 100.0 /100 | #41 | Exceptional 6.0% |
| Estonians | 100.0 /100 | #42 | Exceptional 6.0% |
| Immigrants | Saudi Arabia | 100.0 /100 | #43 | Exceptional 5.9% |
| Argentineans | 100.0 /100 | #44 | Exceptional 5.9% |
| Immigrants | South Central Asia | 100.0 /100 | #45 | Exceptional 5.9% |
| Immigrants | Argentina | 100.0 /100 | #46 | Exceptional 5.9% |
| Australians | 100.0 /100 | #47 | Exceptional 5.9% |
Demographics Similar to West Indians by Professional Degree
In terms of professional degree, the demographic groups most similar to West Indians are Immigrants from Vietnam (4.0%, a difference of 0.16%), Portuguese (4.1%, a difference of 0.31%), Immigrants from Ghana (4.1%, a difference of 0.37%), Dutch (4.0%, a difference of 0.37%), and Immigrants from South Eastern Asia (4.0%, a difference of 0.40%).
| Demographics | Rating | Rank | Professional Degree |
| Immigrants | Panama | 12.3 /100 | #209 | Poor 4.1% |
| Immigrants | Nigeria | 11.7 /100 | #210 | Poor 4.1% |
| Germans | 11.6 /100 | #211 | Poor 4.1% |
| Whites/Caucasians | 11.2 /100 | #212 | Poor 4.1% |
| Koreans | 10.7 /100 | #213 | Poor 4.1% |
| Immigrants | Ghana | 10.6 /100 | #214 | Poor 4.1% |
| Portuguese | 10.5 /100 | #215 | Poor 4.1% |
| West Indians | 9.8 /100 | #216 | Tragic 4.1% |
| Immigrants | Vietnam | 9.4 /100 | #217 | Tragic 4.0% |
| Dutch | 9.0 /100 | #218 | Tragic 4.0% |
| Immigrants | South Eastern Asia | 8.9 /100 | #219 | Tragic 4.0% |
| Ute | 8.2 /100 | #220 | Tragic 4.0% |
| French Canadians | 8.0 /100 | #221 | Tragic 4.0% |
| Immigrants | Western Africa | 7.5 /100 | #222 | Tragic 4.0% |
| Immigrants | Bosnia and Herzegovina | 7.4 /100 | #223 | Tragic 4.0% |