Sioux vs Tlingit-Haida 9th Grade
COMPARE
Sioux
Tlingit-Haida
9th Grade
9th Grade Comparison
Sioux
Tlingit-Haida
95.9%
9TH GRADE
99.8/ 100
METRIC RATING
61st/ 347
METRIC RANK
96.6%
9TH GRADE
100.0/ 100
METRIC RATING
9th/ 347
METRIC RANK
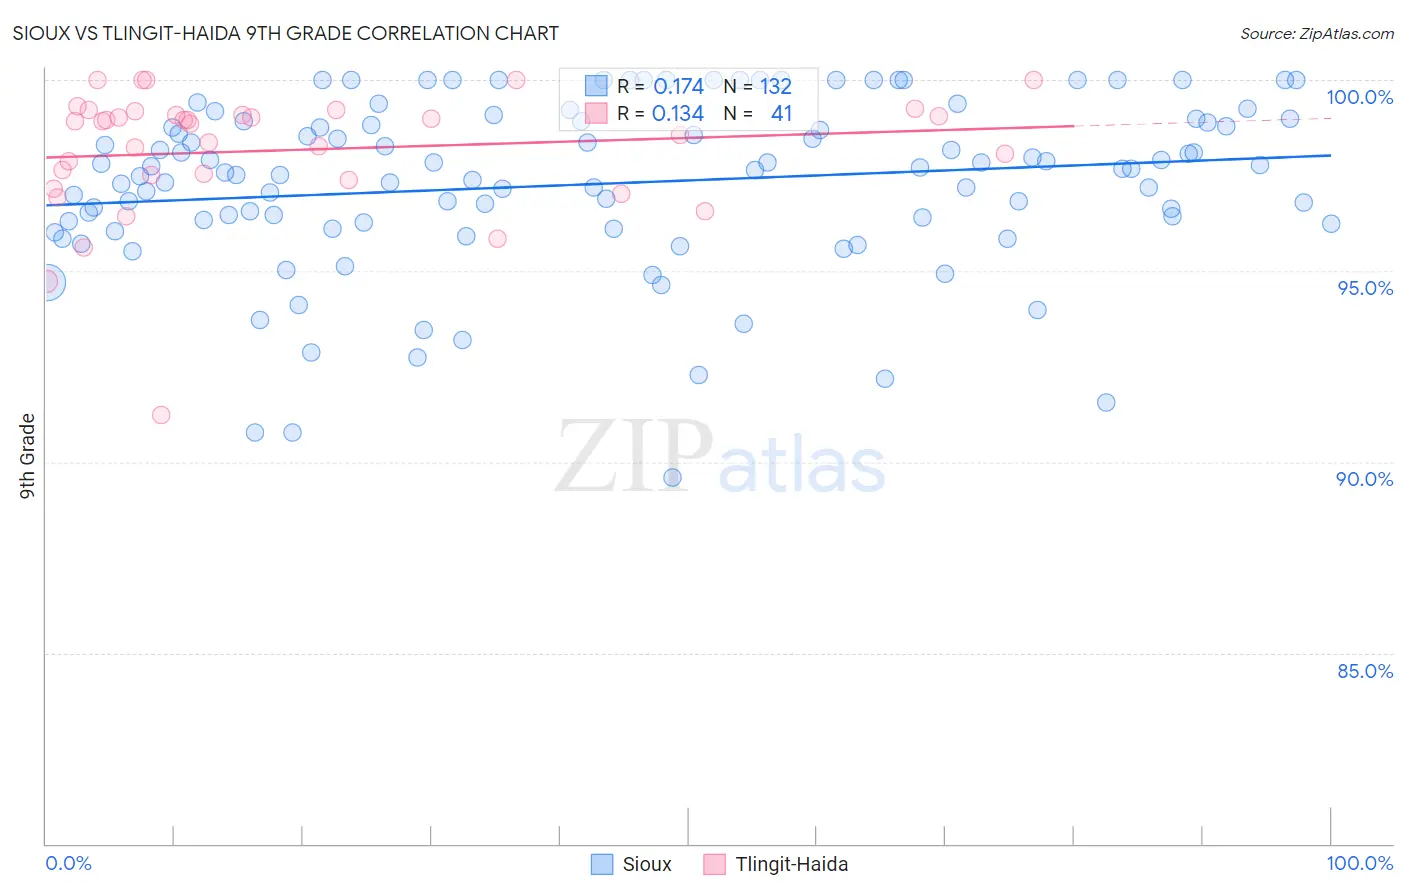
Sioux vs Tlingit-Haida 9th Grade Correlation Chart
The statistical analysis conducted on geographies consisting of 234,196,827 people shows a poor positive correlation between the proportion of Sioux and percentage of population with at least 9th grade education in the United States with a correlation coefficient (R) of 0.174 and weighted average of 95.9%. Similarly, the statistical analysis conducted on geographies consisting of 60,871,919 people shows a poor positive correlation between the proportion of Tlingit-Haida and percentage of population with at least 9th grade education in the United States with a correlation coefficient (R) of 0.134 and weighted average of 96.6%, a difference of 0.74%.
9th Grade Correlation Summary
| Measurement | Sioux | Tlingit-Haida |
| Minimum | 89.6% | 91.2% |
| Maximum | 100.0% | 100.0% |
| Range | 10.4% | 8.8% |
| Mean | 97.3% | 98.2% |
| Median | 97.7% | 98.9% |
| Interquartile 25% (IQ1) | 96.3% | 97.4% |
| Interquartile 75% (IQ3) | 98.9% | 99.1% |
| Interquartile Range (IQR) | 2.6% | 1.7% |
| Standard Deviation (Sample) | 2.2% | 1.7% |
| Standard Deviation (Population) | 2.2% | 1.7% |
Similar Demographics by 9th Grade
Demographics Similar to Sioux by 9th Grade
In terms of 9th grade, the demographic groups most similar to Sioux are Native Hawaiian (95.9%, a difference of 0.010%), Ukrainian (95.9%, a difference of 0.010%), New Zealander (95.9%, a difference of 0.030%), Aleut (96.0%, a difference of 0.040%), and Macedonian (96.0%, a difference of 0.050%).
| Demographics | Rating | Rank | 9th Grade |
| Immigrants | Canada | 99.8 /100 | #54 | Exceptional 96.0% |
| Immigrants | Austria | 99.8 /100 | #55 | Exceptional 96.0% |
| Immigrants | North America | 99.8 /100 | #56 | Exceptional 96.0% |
| Macedonians | 99.8 /100 | #57 | Exceptional 96.0% |
| Aleuts | 99.8 /100 | #58 | Exceptional 96.0% |
| New Zealanders | 99.8 /100 | #59 | Exceptional 95.9% |
| Native Hawaiians | 99.8 /100 | #60 | Exceptional 95.9% |
| Sioux | 99.8 /100 | #61 | Exceptional 95.9% |
| Ukrainians | 99.7 /100 | #62 | Exceptional 95.9% |
| Canadians | 99.7 /100 | #63 | Exceptional 95.9% |
| Zimbabweans | 99.7 /100 | #64 | Exceptional 95.9% |
| Immigrants | England | 99.6 /100 | #65 | Exceptional 95.9% |
| Immigrants | Netherlands | 99.6 /100 | #66 | Exceptional 95.8% |
| Cypriots | 99.6 /100 | #67 | Exceptional 95.8% |
| Immigrants | Ireland | 99.6 /100 | #68 | Exceptional 95.8% |
Demographics Similar to Tlingit-Haida by 9th Grade
In terms of 9th grade, the demographic groups most similar to Tlingit-Haida are Lithuanian (96.6%, a difference of 0.040%), Finnish (96.6%, a difference of 0.040%), English (96.6%, a difference of 0.060%), German (96.7%, a difference of 0.080%), and Carpatho Rusyn (96.7%, a difference of 0.090%).
| Demographics | Rating | Rank | 9th Grade |
| Norwegians | 100.0 /100 | #2 | Exceptional 96.9% |
| Slovaks | 100.0 /100 | #3 | Exceptional 96.9% |
| Slovenes | 100.0 /100 | #4 | Exceptional 96.7% |
| Swedes | 100.0 /100 | #5 | Exceptional 96.7% |
| Poles | 100.0 /100 | #6 | Exceptional 96.7% |
| Carpatho Rusyns | 100.0 /100 | #7 | Exceptional 96.7% |
| Germans | 100.0 /100 | #8 | Exceptional 96.7% |
| Tlingit-Haida | 100.0 /100 | #9 | Exceptional 96.6% |
| Lithuanians | 100.0 /100 | #10 | Exceptional 96.6% |
| Finns | 100.0 /100 | #11 | Exceptional 96.6% |
| English | 100.0 /100 | #12 | Exceptional 96.6% |
| Danes | 100.0 /100 | #13 | Exceptional 96.5% |
| Scottish | 100.0 /100 | #14 | Exceptional 96.5% |
| Irish | 100.0 /100 | #15 | Exceptional 96.5% |
| Croatians | 100.0 /100 | #16 | Exceptional 96.5% |