Sioux vs French American Indian College, 1 year or more
COMPARE
Sioux
French American Indian
College, 1 year or more
College, 1 year or more Comparison
Sioux
French American Indians
53.0%
COLLEGE, 1 YEAR OR MORE
0.0/ 100
METRIC RATING
296th/ 347
METRIC RANK
55.8%
COLLEGE, 1 YEAR OR MORE
1.0/ 100
METRIC RATING
241st/ 347
METRIC RANK
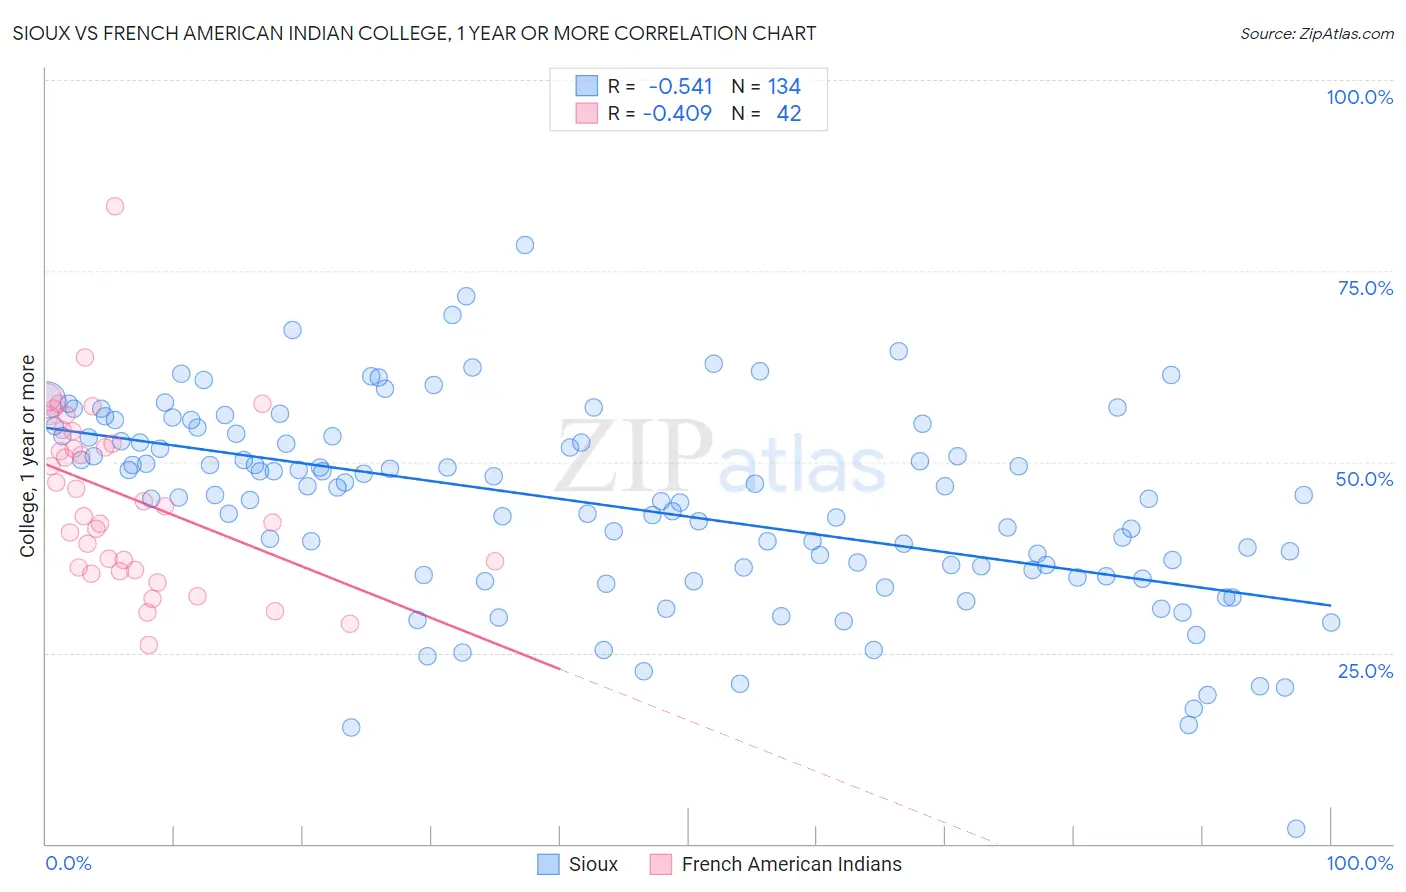
Sioux vs French American Indian College, 1 year or more Correlation Chart
The statistical analysis conducted on geographies consisting of 234,199,467 people shows a substantial negative correlation between the proportion of Sioux and percentage of population with at least college, 1 year or more education in the United States with a correlation coefficient (R) of -0.541 and weighted average of 53.0%. Similarly, the statistical analysis conducted on geographies consisting of 131,976,089 people shows a moderate negative correlation between the proportion of French American Indians and percentage of population with at least college, 1 year or more education in the United States with a correlation coefficient (R) of -0.409 and weighted average of 55.8%, a difference of 5.3%.
College, 1 year or more Correlation Summary
| Measurement | Sioux | French American Indian |
| Minimum | 2.0% | 26.1% |
| Maximum | 78.4% | 83.5% |
| Range | 76.4% | 57.5% |
| Mean | 44.3% | 45.6% |
| Median | 45.6% | 44.5% |
| Interquartile 25% (IQ1) | 35.8% | 36.2% |
| Interquartile 75% (IQ3) | 53.3% | 54.0% |
| Interquartile Range (IQR) | 17.5% | 17.7% |
| Standard Deviation (Sample) | 13.0% | 11.5% |
| Standard Deviation (Population) | 12.9% | 11.4% |
Similar Demographics by College, 1 year or more
Demographics Similar to Sioux by College, 1 year or more
In terms of college, 1 year or more, the demographic groups most similar to Sioux are Paiute (52.9%, a difference of 0.28%), Yaqui (53.2%, a difference of 0.34%), Cherokee (53.2%, a difference of 0.35%), Black/African American (53.3%, a difference of 0.56%), and Chickasaw (53.3%, a difference of 0.58%).
| Demographics | Rating | Rank | College, 1 year or more |
| Immigrants | Ecuador | 0.0 /100 | #289 | Tragic 53.4% |
| Alaskan Athabascans | 0.0 /100 | #290 | Tragic 53.4% |
| Cubans | 0.0 /100 | #291 | Tragic 53.4% |
| Chickasaw | 0.0 /100 | #292 | Tragic 53.3% |
| Blacks/African Americans | 0.0 /100 | #293 | Tragic 53.3% |
| Cherokee | 0.0 /100 | #294 | Tragic 53.2% |
| Yaqui | 0.0 /100 | #295 | Tragic 53.2% |
| Sioux | 0.0 /100 | #296 | Tragic 53.0% |
| Paiute | 0.0 /100 | #297 | Tragic 52.9% |
| Immigrants | Dominica | 0.0 /100 | #298 | Tragic 52.5% |
| Immigrants | Nicaragua | 0.0 /100 | #299 | Tragic 52.4% |
| Choctaw | 0.0 /100 | #300 | Tragic 52.3% |
| Haitians | 0.0 /100 | #301 | Tragic 52.3% |
| Puerto Ricans | 0.0 /100 | #302 | Tragic 52.2% |
| Creek | 0.0 /100 | #303 | Tragic 52.2% |
Demographics Similar to French American Indians by College, 1 year or more
In terms of college, 1 year or more, the demographic groups most similar to French American Indians are Trinidadian and Tobagonian (55.8%, a difference of 0.050%), Marshallese (55.8%, a difference of 0.11%), Osage (55.8%, a difference of 0.12%), Puget Sound Salish (55.9%, a difference of 0.14%), and Chippewa (55.7%, a difference of 0.24%).
| Demographics | Rating | Rank | College, 1 year or more |
| Spanish Americans | 1.8 /100 | #234 | Tragic 56.3% |
| West Indians | 1.8 /100 | #235 | Tragic 56.3% |
| Iroquois | 1.7 /100 | #236 | Tragic 56.2% |
| Samoans | 1.6 /100 | #237 | Tragic 56.2% |
| Barbadians | 1.3 /100 | #238 | Tragic 56.0% |
| Puget Sound Salish | 1.1 /100 | #239 | Tragic 55.9% |
| Trinidadians and Tobagonians | 1.1 /100 | #240 | Tragic 55.8% |
| French American Indians | 1.0 /100 | #241 | Tragic 55.8% |
| Marshallese | 1.0 /100 | #242 | Tragic 55.8% |
| Osage | 1.0 /100 | #243 | Tragic 55.8% |
| Chippewa | 0.9 /100 | #244 | Tragic 55.7% |
| Immigrants | Liberia | 0.8 /100 | #245 | Tragic 55.7% |
| Malaysians | 0.8 /100 | #246 | Tragic 55.6% |
| Hawaiians | 0.8 /100 | #247 | Tragic 55.6% |
| Immigrants | Congo | 0.8 /100 | #248 | Tragic 55.6% |