Sioux vs Immigrants from China College, 1 year or more
COMPARE
Sioux
Immigrants from China
College, 1 year or more
College, 1 year or more Comparison
Sioux
Immigrants from China
53.0%
COLLEGE, 1 YEAR OR MORE
0.0/ 100
METRIC RATING
296th/ 347
METRIC RANK
66.4%
COLLEGE, 1 YEAR OR MORE
100.0/ 100
METRIC RATING
23rd/ 347
METRIC RANK
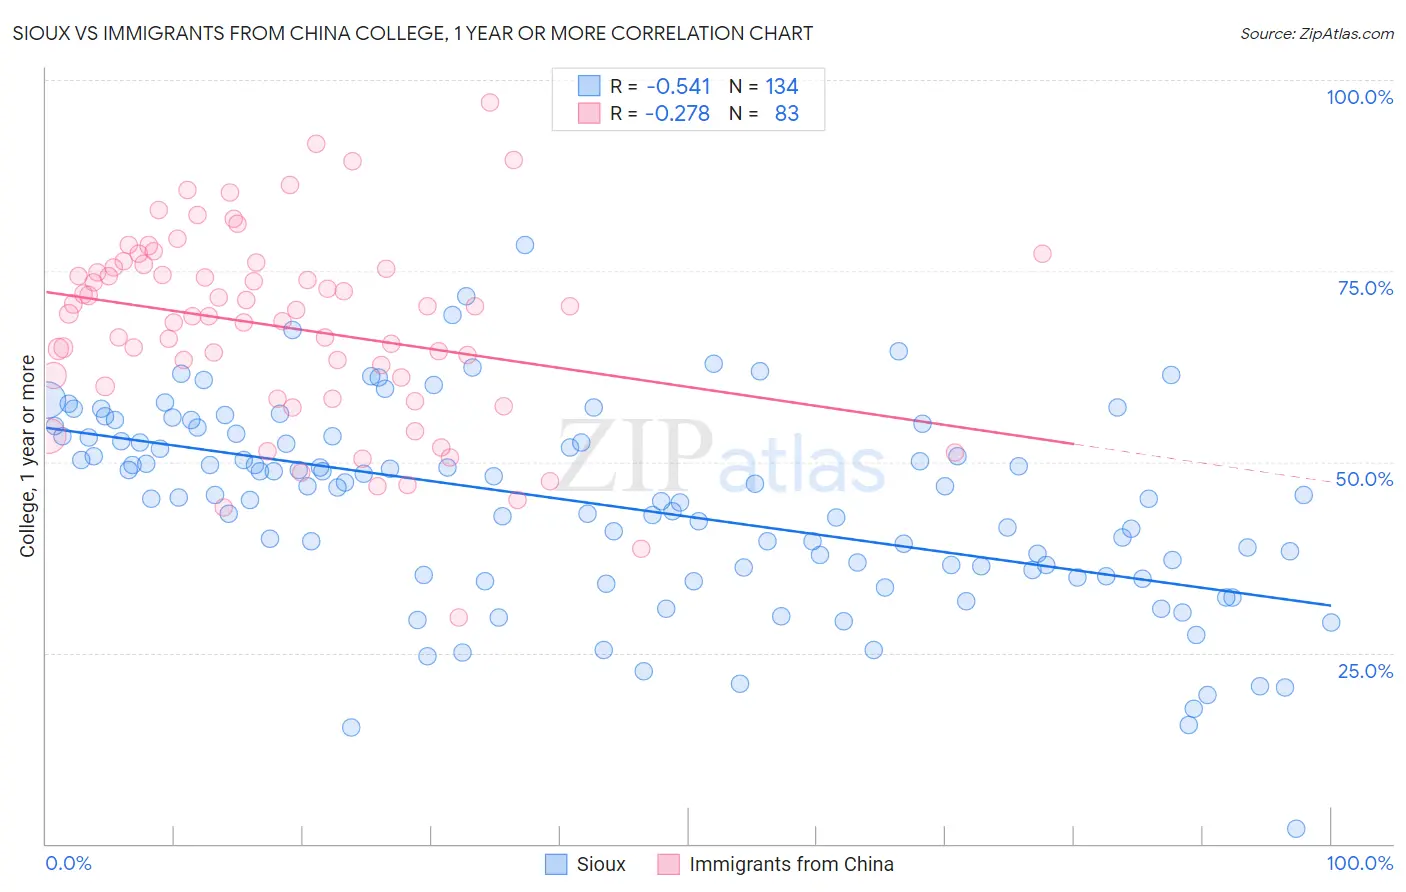
Sioux vs Immigrants from China College, 1 year or more Correlation Chart
The statistical analysis conducted on geographies consisting of 234,199,467 people shows a substantial negative correlation between the proportion of Sioux and percentage of population with at least college, 1 year or more education in the United States with a correlation coefficient (R) of -0.541 and weighted average of 53.0%. Similarly, the statistical analysis conducted on geographies consisting of 457,078,071 people shows a weak negative correlation between the proportion of Immigrants from China and percentage of population with at least college, 1 year or more education in the United States with a correlation coefficient (R) of -0.278 and weighted average of 66.4%, a difference of 25.2%.
College, 1 year or more Correlation Summary
| Measurement | Sioux | Immigrants from China |
| Minimum | 2.0% | 29.7% |
| Maximum | 78.4% | 97.0% |
| Range | 76.4% | 67.3% |
| Mean | 44.3% | 67.6% |
| Median | 45.6% | 69.5% |
| Interquartile 25% (IQ1) | 35.8% | 59.9% |
| Interquartile 75% (IQ3) | 53.3% | 75.5% |
| Interquartile Range (IQR) | 17.5% | 15.7% |
| Standard Deviation (Sample) | 13.0% | 12.7% |
| Standard Deviation (Population) | 12.9% | 12.6% |
Similar Demographics by College, 1 year or more
Demographics Similar to Sioux by College, 1 year or more
In terms of college, 1 year or more, the demographic groups most similar to Sioux are Paiute (52.9%, a difference of 0.28%), Yaqui (53.2%, a difference of 0.34%), Cherokee (53.2%, a difference of 0.35%), Black/African American (53.3%, a difference of 0.56%), and Chickasaw (53.3%, a difference of 0.58%).
| Demographics | Rating | Rank | College, 1 year or more |
| Immigrants | Ecuador | 0.0 /100 | #289 | Tragic 53.4% |
| Alaskan Athabascans | 0.0 /100 | #290 | Tragic 53.4% |
| Cubans | 0.0 /100 | #291 | Tragic 53.4% |
| Chickasaw | 0.0 /100 | #292 | Tragic 53.3% |
| Blacks/African Americans | 0.0 /100 | #293 | Tragic 53.3% |
| Cherokee | 0.0 /100 | #294 | Tragic 53.2% |
| Yaqui | 0.0 /100 | #295 | Tragic 53.2% |
| Sioux | 0.0 /100 | #296 | Tragic 53.0% |
| Paiute | 0.0 /100 | #297 | Tragic 52.9% |
| Immigrants | Dominica | 0.0 /100 | #298 | Tragic 52.5% |
| Immigrants | Nicaragua | 0.0 /100 | #299 | Tragic 52.4% |
| Choctaw | 0.0 /100 | #300 | Tragic 52.3% |
| Haitians | 0.0 /100 | #301 | Tragic 52.3% |
| Puerto Ricans | 0.0 /100 | #302 | Tragic 52.2% |
| Creek | 0.0 /100 | #303 | Tragic 52.2% |
Demographics Similar to Immigrants from China by College, 1 year or more
In terms of college, 1 year or more, the demographic groups most similar to Immigrants from China are Soviet Union (66.4%, a difference of 0.060%), Immigrants from Belgium (66.3%, a difference of 0.080%), Immigrants from Hong Kong (66.4%, a difference of 0.12%), Immigrants from Korea (66.5%, a difference of 0.19%), and Immigrants from Switzerland (66.5%, a difference of 0.23%).
| Demographics | Rating | Rank | College, 1 year or more |
| Immigrants | Japan | 100.0 /100 | #16 | Exceptional 66.7% |
| Immigrants | Eastern Asia | 100.0 /100 | #17 | Exceptional 66.6% |
| Eastern Europeans | 100.0 /100 | #18 | Exceptional 66.6% |
| Immigrants | Switzerland | 100.0 /100 | #19 | Exceptional 66.5% |
| Immigrants | Korea | 100.0 /100 | #20 | Exceptional 66.5% |
| Immigrants | Hong Kong | 100.0 /100 | #21 | Exceptional 66.4% |
| Soviet Union | 100.0 /100 | #22 | Exceptional 66.4% |
| Immigrants | China | 100.0 /100 | #23 | Exceptional 66.4% |
| Immigrants | Belgium | 100.0 /100 | #24 | Exceptional 66.3% |
| Indians (Asian) | 100.0 /100 | #25 | Exceptional 66.1% |
| Latvians | 100.0 /100 | #26 | Exceptional 66.1% |
| Immigrants | Ireland | 100.0 /100 | #27 | Exceptional 65.9% |
| Immigrants | France | 100.0 /100 | #28 | Exceptional 65.8% |
| Immigrants | Northern Europe | 100.0 /100 | #29 | Exceptional 65.6% |
| Immigrants | Denmark | 100.0 /100 | #30 | Exceptional 65.6% |