Sioux vs Asian 10th Grade
COMPARE
Sioux
Asian
10th Grade
10th Grade Comparison
Sioux
Asians
94.4%
10TH GRADE
96.2/ 100
METRIC RATING
116th/ 347
METRIC RANK
93.5%
10TH GRADE
23.0/ 100
METRIC RATING
199th/ 347
METRIC RANK
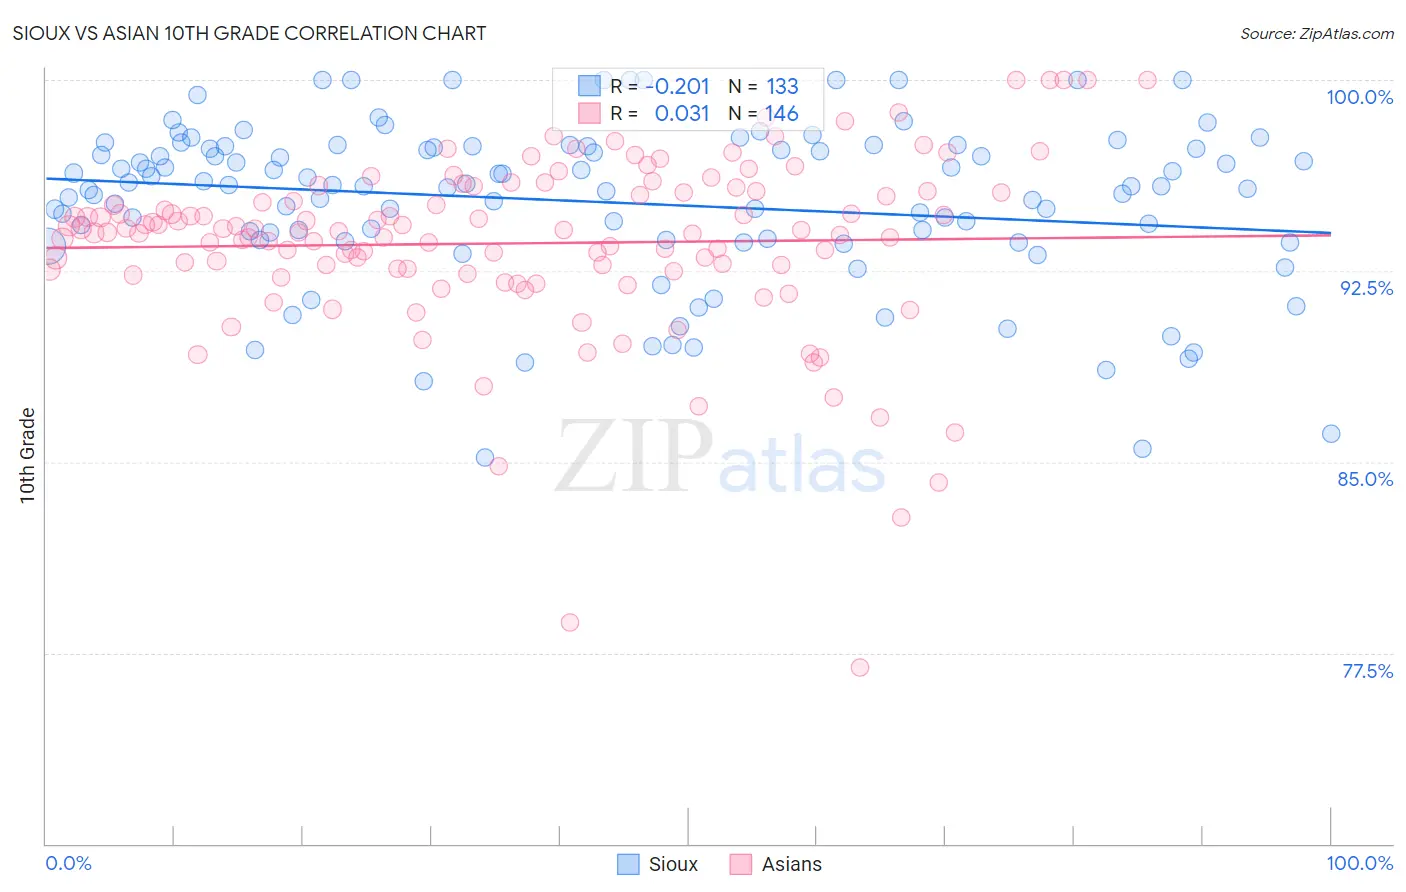
Sioux vs Asian 10th Grade Correlation Chart
The statistical analysis conducted on geographies consisting of 234,198,073 people shows a weak negative correlation between the proportion of Sioux and percentage of population with at least 10th grade education in the United States with a correlation coefficient (R) of -0.201 and weighted average of 94.4%. Similarly, the statistical analysis conducted on geographies consisting of 550,778,127 people shows no correlation between the proportion of Asians and percentage of population with at least 10th grade education in the United States with a correlation coefficient (R) of 0.031 and weighted average of 93.5%, a difference of 1.0%.
10th Grade Correlation Summary
| Measurement | Sioux | Asian |
| Minimum | 85.2% | 76.9% |
| Maximum | 100.0% | 100.0% |
| Range | 14.8% | 23.1% |
| Mean | 95.2% | 93.6% |
| Median | 95.9% | 94.0% |
| Interquartile 25% (IQ1) | 93.7% | 92.5% |
| Interquartile 75% (IQ3) | 97.4% | 95.6% |
| Interquartile Range (IQR) | 3.6% | 3.1% |
| Standard Deviation (Sample) | 3.2% | 3.5% |
| Standard Deviation (Population) | 3.2% | 3.5% |
Similar Demographics by 10th Grade
Demographics Similar to Sioux by 10th Grade
In terms of 10th grade, the demographic groups most similar to Sioux are German Russian (94.4%, a difference of 0.0%), Delaware (94.4%, a difference of 0.0%), Palestinian (94.4%, a difference of 0.020%), Immigrants from Hungary (94.4%, a difference of 0.030%), and Immigrants from Zimbabwe (94.4%, a difference of 0.040%).
| Demographics | Rating | Rank | 10th Grade |
| Immigrants | Norway | 97.2 /100 | #109 | Exceptional 94.5% |
| Burmese | 97.1 /100 | #110 | Exceptional 94.5% |
| Immigrants | Zimbabwe | 96.8 /100 | #111 | Exceptional 94.4% |
| Immigrants | Kuwait | 96.8 /100 | #112 | Exceptional 94.4% |
| Palestinians | 96.5 /100 | #113 | Exceptional 94.4% |
| German Russians | 96.3 /100 | #114 | Exceptional 94.4% |
| Delaware | 96.3 /100 | #115 | Exceptional 94.4% |
| Sioux | 96.2 /100 | #116 | Exceptional 94.4% |
| Immigrants | Hungary | 95.8 /100 | #117 | Exceptional 94.4% |
| Jordanians | 95.6 /100 | #118 | Exceptional 94.4% |
| Immigrants | Israel | 95.4 /100 | #119 | Exceptional 94.4% |
| Immigrants | Taiwan | 95.3 /100 | #120 | Exceptional 94.4% |
| Immigrants | Belarus | 95.2 /100 | #121 | Exceptional 94.4% |
| Inupiat | 95.1 /100 | #122 | Exceptional 94.4% |
| Cree | 95.1 /100 | #123 | Exceptional 94.4% |
Demographics Similar to Asians by 10th Grade
In terms of 10th grade, the demographic groups most similar to Asians are Immigrants from Micronesia (93.5%, a difference of 0.0%), Pueblo (93.5%, a difference of 0.010%), Hopi (93.5%, a difference of 0.010%), Hawaiian (93.5%, a difference of 0.020%), and Moroccan (93.5%, a difference of 0.030%).
| Demographics | Rating | Rank | 10th Grade |
| Immigrants | Malaysia | 28.0 /100 | #192 | Fair 93.5% |
| Panamanians | 28.0 /100 | #193 | Fair 93.5% |
| Immigrants | Morocco | 26.9 /100 | #194 | Fair 93.5% |
| Cheyenne | 26.8 /100 | #195 | Fair 93.5% |
| Moroccans | 25.3 /100 | #196 | Fair 93.5% |
| Pueblo | 23.9 /100 | #197 | Fair 93.5% |
| Immigrants | Micronesia | 23.2 /100 | #198 | Fair 93.5% |
| Asians | 23.0 /100 | #199 | Fair 93.5% |
| Hopi | 22.2 /100 | #200 | Fair 93.5% |
| Hawaiians | 21.8 /100 | #201 | Fair 93.5% |
| Immigrants | Uganda | 20.9 /100 | #202 | Fair 93.5% |
| Immigrants | Western Asia | 20.6 /100 | #203 | Fair 93.4% |
| Ute | 20.3 /100 | #204 | Fair 93.4% |
| Immigrants | Indonesia | 20.2 /100 | #205 | Fair 93.4% |
| Immigrants | Sudan | 20.0 /100 | #206 | Fair 93.4% |