Mexican American Indian vs Immigrants from Latvia 7th Grade

COMPARE

Mexican American Indian
Race
Ancestry
AfghanAfricanAlaska NativeAlaskan AthabascanAlbanianAleutAlsatianAmericanApacheArabArapahoArgentineanArmenianAssyrian/Chaldean/SyriacAustralianAustrianBahamianBangladeshiBarbadianBasqueBelgianBelizeanBermudanBhutaneseBlackfeetBolivianBrazilianBritishBritish West IndianBulgarianBurmeseCajunCambodianCanadianCape VerdeanCarpatho RusynCelticCentral AmericanCentral American IndianCherokeeCheyenneChickasawChileanChineseChippewaChoctawColombianColvilleComancheCosta RicanCreeCreekCroatianCrowCubanCypriotCzechCzechoslovakianDanishDelawareDominicanDutchDutch West IndianEastern EuropeanEcuadorianEgyptianEnglishEstonianEthiopianEuropeanFijianFilipinoFinnishFrenchFrench American IndianFrench CanadianGermanGerman RussianGhanaianGreekGuamanian/ChamorroGuatemalanGuyaneseHaitianHmongHonduranHopiHoumaHungarianIcelanderIndian (Asian)IndonesianInupiatIranianIraqiIrishIroquoisIsraeliItalianJamaicanJapaneseJordanianKenyanKiowaKoreanLaotianLatvianLebaneseLiberianLithuanianLumbeeLuxembourgerMacedonianMalaysianMalteseMarshalleseMenomineeMexicanMexican American IndianMongolianMoroccanNative HawaiianNavajoNepaleseNew ZealanderNicaraguanNigerianNorthern EuropeanNorwegianOkinawanOsageOttawaPaiutePakistaniPalestinianPanamanianParaguayanPennsylvania GermanPeruvianPimaPolishPortuguesePotawatomiPuebloPuerto RicanPuget Sound SalishRomanianRussianSalvadoranSamoanScandinavianScotch-IrishScottishSeminoleSenegaleseSerbianShoshoneSierra LeoneanSiouxSlavicSlovakSloveneSomaliSouth AfricanSouth AmericanSouth American IndianSoviet UnionSpaniardSpanishSpanish AmericanSpanish American IndianSri LankanSubsaharan AfricanSudaneseSwedishSwissSyrianTaiwaneseThaiTlingit-HaidaTohono O'OdhamTonganTrinidadian and TobagonianTsimshianTurkishU.S. Virgin IslanderUgandanUkrainianUruguayanUteVenezuelanVietnameseWelshWest IndianYakamaYaquiYugoslavianYumanYup'ikZimbabwean
Immigration
NonimmigrantsImmigrantsAfghanistanAfricaAlbaniaArgentinaArmeniaAsiaAustraliaAustriaBahamasBangladeshBarbadosBelarusBelgiumBelizeBoliviaBosnia and HerzegovinaBrazilBulgariaBurma/MyanmarCabo VerdeCambodiaCameroonCanadaCaribbeanCentral AmericaChileChinaColombiaCongoCosta RicaCroatiaCubaCzechoslovakiaDenmarkDominicaDominican RepublicEastern AfricaEastern AsiaEastern EuropeEcuadorEgyptEl SalvadorEnglandEritreaEthiopiaEuropeFijiFranceGermanyGhanaGreeceGrenadaGuatemalaGuyanaHaitiHondurasHong KongHungaryIndiaIndonesiaIranIraqIrelandIsraelItalyJamaicaJapanJordanKazakhstanKenyaKoreaKuwaitLaosLatin AmericaLebanonLiberiaLithuaniaMalaysiaMexicoMicronesiaMiddle AfricaMoldovaMoroccoNepalNetherlandsNicaraguaNigeriaNorth AmericaNorth MacedoniaNorthern AfricaNorthern EuropeNorwayOceaniaPakistanPanamaPeruPhilippinesPolandPortugalRomaniaRussiaSaudi ArabiaScotlandSenegalSerbiaSierra LeoneSingaporeSomaliaSouth AfricaSouth AmericaSouth Central AsiaSouth Eastern AsiaSouthern EuropeSpainSri LankaSt. Vincent and the GrenadinesSudanSwedenSwitzerlandSyriaTaiwanThailandTrinidad and TobagoTurkeyUgandaUkraineUruguayUzbekistanVenezuelaVietnamWest IndiesWestern AfricaWestern AsiaWestern EuropeYemenZaireZimbabweAzores
Immigrants from Latvia
Race
Ancestry
AfghanAfricanAlaska NativeAlaskan AthabascanAlbanianAleutAlsatianAmericanApacheArabArapahoArgentineanArmenianAssyrian/Chaldean/SyriacAustralianAustrianBahamianBangladeshiBarbadianBasqueBelgianBelizeanBermudanBhutaneseBlackfeetBolivianBrazilianBritishBritish West IndianBulgarianBurmeseCajunCambodianCanadianCape VerdeanCarpatho RusynCelticCentral AmericanCentral American IndianCherokeeCheyenneChickasawChileanChineseChippewaChoctawColombianColvilleComancheCosta RicanCreeCreekCroatianCrowCubanCypriotCzechCzechoslovakianDanishDelawareDominicanDutchDutch West IndianEastern EuropeanEcuadorianEgyptianEnglishEstonianEthiopianEuropeanFijianFilipinoFinnishFrenchFrench American IndianFrench CanadianGermanGerman RussianGhanaianGreekGuamanian/ChamorroGuatemalanGuyaneseHaitianHmongHonduranHopiHoumaHungarianIcelanderIndian (Asian)IndonesianInupiatIranianIraqiIrishIroquoisIsraeliItalianJamaicanJapaneseJordanianKenyanKiowaKoreanLaotianLatvianLebaneseLiberianLithuanianLumbeeLuxembourgerMacedonianMalaysianMalteseMarshalleseMenomineeMexicanMongolianMoroccanNative HawaiianNavajoNepaleseNew ZealanderNicaraguanNigerianNorthern EuropeanNorwegianOkinawanOsageOttawaPaiutePakistaniPalestinianPanamanianParaguayanPennsylvania GermanPeruvianPimaPolishPortuguesePotawatomiPuebloPuerto RicanPuget Sound SalishRomanianRussianSalvadoranSamoanScandinavianScotch-IrishScottishSeminoleSenegaleseSerbianShoshoneSierra LeoneanSiouxSlavicSlovakSloveneSomaliSouth AfricanSouth AmericanSouth American IndianSoviet UnionSpaniardSpanishSpanish AmericanSpanish American IndianSri LankanSubsaharan AfricanSudaneseSwedishSwissSyrianTaiwaneseThaiTlingit-HaidaTohono O'OdhamTonganTrinidadian and TobagonianTsimshianTurkishU.S. Virgin IslanderUgandanUkrainianUruguayanUteVenezuelanVietnameseWelshWest IndianYakamaYaquiYugoslavianYumanYup'ikZimbabwean
Immigration
NonimmigrantsImmigrantsAfghanistanAfricaAlbaniaArgentinaArmeniaAsiaAustraliaAustriaBahamasBangladeshBarbadosBelarusBelgiumBelizeBoliviaBosnia and HerzegovinaBrazilBulgariaBurma/MyanmarCabo VerdeCambodiaCameroonCanadaCaribbeanCentral AmericaChileChinaColombiaCongoCosta RicaCroatiaCubaCzechoslovakiaDenmarkDominicaDominican RepublicEastern AfricaEastern AsiaEastern EuropeEcuadorEgyptEl SalvadorEnglandEritreaEthiopiaEuropeFijiFranceGermanyGhanaGreeceGrenadaGuatemalaGuyanaHaitiHondurasHong KongHungaryIndiaIndonesiaIranIraqIrelandIsraelItalyJamaicaJapanJordanKazakhstanKenyaKoreaKuwaitLaosLatin AmericaLatviaLebanonLiberiaLithuaniaMalaysiaMexicoMicronesiaMiddle AfricaMoldovaMoroccoNepalNetherlandsNicaraguaNigeriaNorth AmericaNorth MacedoniaNorthern AfricaNorthern EuropeNorwayOceaniaPakistanPanamaPeruPhilippinesPolandPortugalRomaniaRussiaSaudi ArabiaScotlandSenegalSerbiaSierra LeoneSingaporeSomaliaSouth AfricaSouth AmericaSouth Central AsiaSouth Eastern AsiaSouthern EuropeSpainSri LankaSt. Vincent and the GrenadinesSudanSwedenSwitzerlandSyriaTaiwanThailandTrinidad and TobagoTurkeyUgandaUkraineUruguayUzbekistanVenezuelaVietnamWest IndiesWestern AfricaWestern AsiaWestern EuropeYemenZaireZimbabweAzores
7th Grade
Income
Poverty
Unemployment
Labor Participation
Family Structure
Vehicle Availability
Education Level
Disability

7th Grade Comparison

Mexican American Indians

Immigrants from Latvia

Tragic
Exceptional
92.6%
7TH GRADE
0.0/ 100
METRIC RATING
335th/ 347
METRIC RANK
96.6%
7TH GRADE
97.4/ 100
METRIC RATING
111th/ 347
METRIC RANK

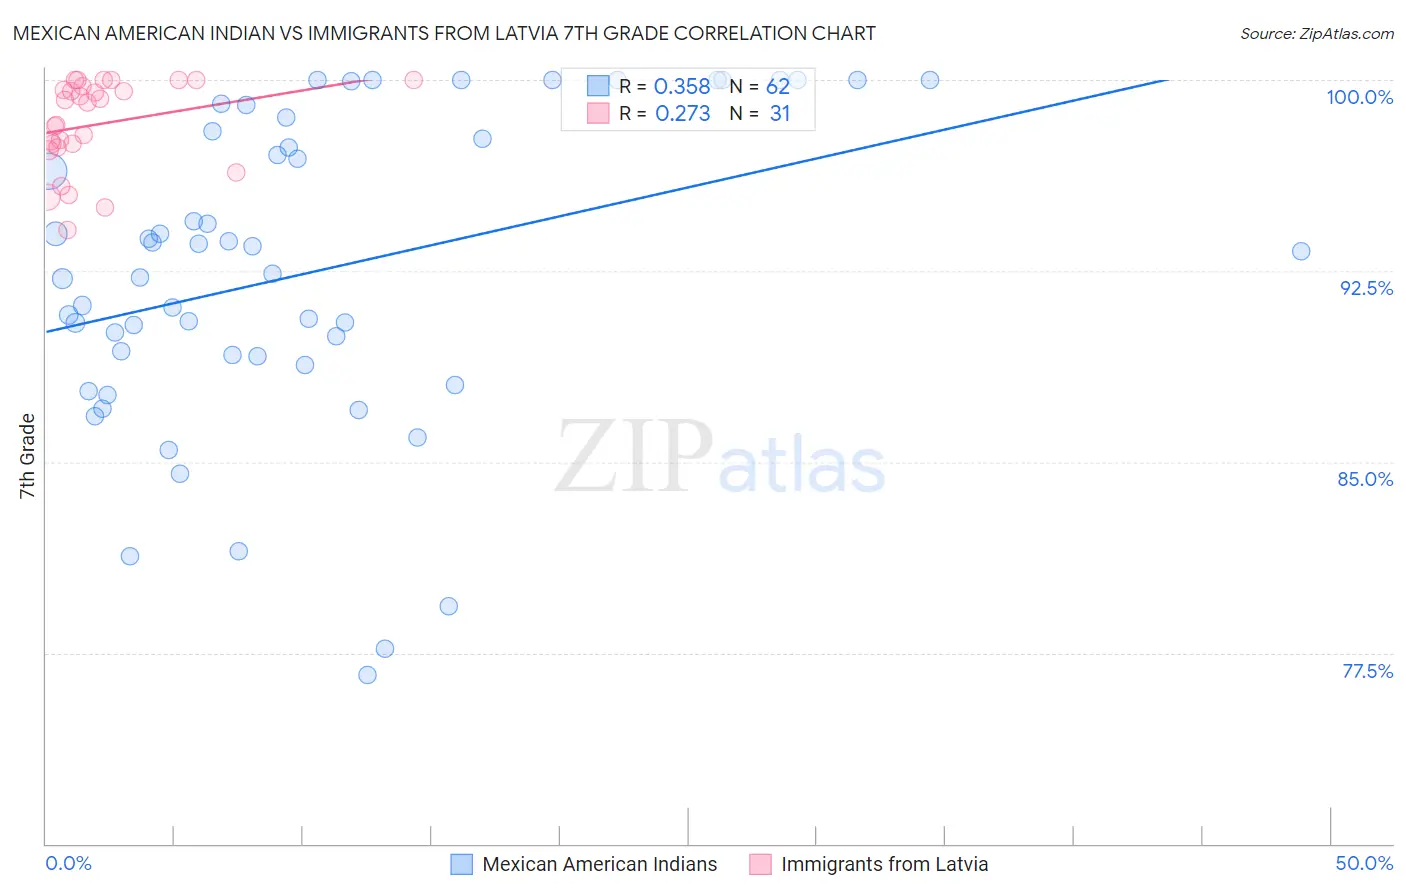
Mexican American Indian vs Immigrants from Latvia 7th Grade Correlation Chart

The statistical analysis conducted on geographies consisting of 317,621,104 people shows a mild positive correlation between the proportion of Mexican American Indians and percentage of population with at least 7th grade education in the United States with a correlation coefficient (R) of 0.358 and weighted average of 92.6%. Similarly, the statistical analysis conducted on geographies consisting of 113,735,345 people shows a weak positive correlation between the proportion of Immigrants from Latvia and percentage of population with at least 7th grade education in the United States with a correlation coefficient (R) of 0.273 and weighted average of 96.6%, a difference of 4.3%.
Mexican American Indian vs Immigrants from Latvia 7th Grade

7th Grade Correlation Summary

MeasurementMexican American IndianImmigrants from Latvia
Minimum76.6%94.1%
Maximum100.0%100.0%
Range23.4%5.9%
Mean92.5%98.3%
Median92.8%99.1%
Interquartile 25% (IQ1)89.2%97.3%
Interquartile 75% (IQ3)98.0%99.8%
Interquartile Range (IQR)8.8%2.4%
Standard Deviation (Sample)6.1%1.7%
Standard Deviation (Population)6.0%1.7%

Similar Demographics by 7th Grade

Demographics Similar to Mexican American Indians by 7th Grade

In terms of 7th grade, the demographic groups most similar to Mexican American Indians are Immigrants from Honduras (92.5%, a difference of 0.070%), Immigrants from Yemen (92.6%, a difference of 0.10%), Immigrants from Armenia (92.7%, a difference of 0.18%), Hispanic or Latino (92.7%, a difference of 0.20%), and Honduran (92.9%, a difference of 0.34%).
DemographicsRating | Rank7th Grade
Immigrants | Nicaragua
0.0
/100
|
#328
Tragic
93.0%
Immigrants | Azores
0.0
/100
|
#329
Tragic
93.0%
Immigrants | Dominican Republic
0.0
/100
|
#330
Tragic
92.9%
Hondurans
0.0
/100
|
#331
Tragic
92.9%
Hispanics or Latinos
0.0
/100
|
#332
Tragic
92.7%
Immigrants | Armenia
0.0
/100
|
#333
Tragic
92.7%
Immigrants | Yemen
0.0
/100
|
#334
Tragic
92.6%
Mexican American Indians
0.0
/100
|
#335
Tragic
92.6%
Immigrants | Honduras
0.0
/100
|
#336
Tragic
92.5%
Immigrants | Latin America
0.0
/100
|
#337
Tragic
92.2%
Central Americans
0.0
/100
|
#338
Tragic
92.1%
Mexicans
0.0
/100
|
#339
Tragic
91.9%
Yakama
0.0
/100
|
#340
Tragic
91.7%
Guatemalans
0.0
/100
|
#341
Tragic
91.7%
Salvadorans
0.0
/100
|
#342
Tragic
91.5%

Demographics Similar to Immigrants from Latvia by 7th Grade

In terms of 7th grade, the demographic groups most similar to Immigrants from Latvia are Okinawan (96.6%, a difference of 0.0%), Bhutanese (96.6%, a difference of 0.020%), Nonimmigrants (96.5%, a difference of 0.020%), Lumbee (96.6%, a difference of 0.030%), and Immigrants from Saudi Arabia (96.6%, a difference of 0.030%).
DemographicsRating | Rank7th Grade
Shoshone
98.1
/100
|
#104
Exceptional
96.6%
South Africans
98.0
/100
|
#105
Exceptional
96.6%
Iroquois
97.9
/100
|
#106
Exceptional
96.6%
Lumbee
97.8
/100
|
#107
Exceptional
96.6%
Immigrants | Saudi Arabia
97.8
/100
|
#108
Exceptional
96.6%
Bhutanese
97.7
/100
|
#109
Exceptional
96.6%
Okinawans
97.4
/100
|
#110
Exceptional
96.6%
Immigrants | Latvia
97.4
/100
|
#111
Exceptional
96.6%
Immigrants | Nonimmigrants
97.0
/100
|
#112
Exceptional
96.5%
Pueblo
96.8
/100
|
#113
Exceptional
96.5%
Immigrants | Zimbabwe
96.6
/100
|
#114
Exceptional
96.5%
Choctaw
96.6
/100
|
#115
Exceptional
96.5%
Syrians
96.6
/100
|
#116
Exceptional
96.5%
Immigrants | Moldova
95.7
/100
|
#117
Exceptional
96.5%
Immigrants | Japan
95.5
/100
|
#118
Exceptional
96.5%