Alsatian vs Immigrants from Congo 7th Grade
COMPARE
Alsatian
Immigrants from Congo
7th Grade
7th Grade Comparison
Alsatians
Immigrants from Congo
96.1%
7TH GRADE
67.2/ 100
METRIC RATING
159th/ 347
METRIC RANK
95.3%
7TH GRADE
0.7/ 100
METRIC RATING
257th/ 347
METRIC RANK
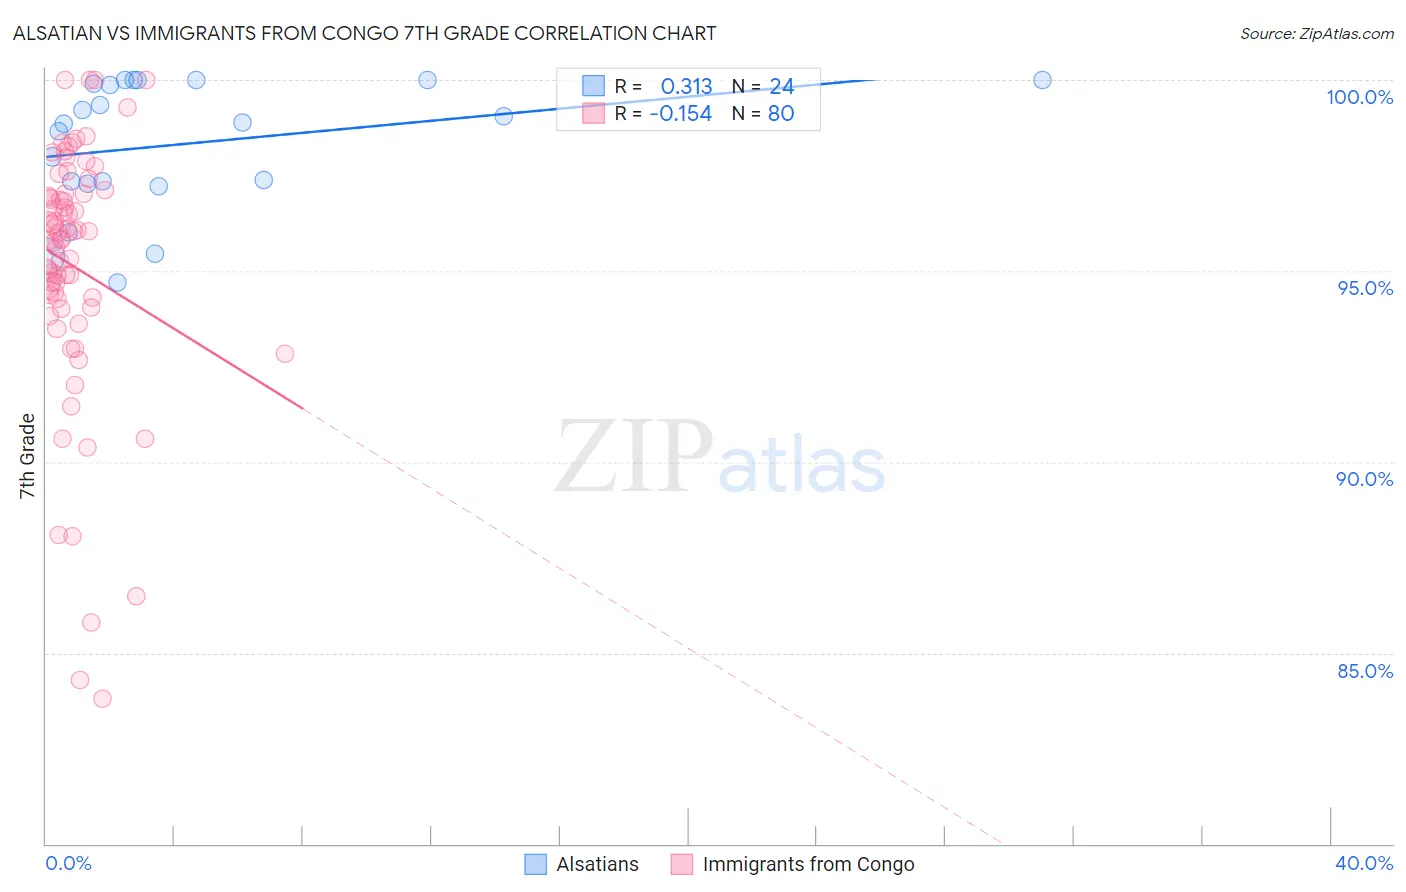
Alsatian vs Immigrants from Congo 7th Grade Correlation Chart
The statistical analysis conducted on geographies consisting of 82,676,581 people shows a mild positive correlation between the proportion of Alsatians and percentage of population with at least 7th grade education in the United States with a correlation coefficient (R) of 0.313 and weighted average of 96.1%. Similarly, the statistical analysis conducted on geographies consisting of 92,124,753 people shows a poor negative correlation between the proportion of Immigrants from Congo and percentage of population with at least 7th grade education in the United States with a correlation coefficient (R) of -0.154 and weighted average of 95.3%, a difference of 0.87%.
7th Grade Correlation Summary
| Measurement | Alsatian | Immigrants from Congo |
| Minimum | 94.7% | 83.8% |
| Maximum | 100.0% | 100.0% |
| Range | 5.3% | 16.2% |
| Mean | 98.3% | 95.1% |
| Median | 98.9% | 95.9% |
| Interquartile 25% (IQ1) | 97.3% | 94.2% |
| Interquartile 75% (IQ3) | 100.0% | 97.0% |
| Interquartile Range (IQR) | 2.6% | 2.9% |
| Standard Deviation (Sample) | 1.7% | 3.4% |
| Standard Deviation (Population) | 1.7% | 3.4% |
Similar Demographics by 7th Grade
Demographics Similar to Alsatians by 7th Grade
In terms of 7th grade, the demographic groups most similar to Alsatians are Immigrants from Kenya (96.1%, a difference of 0.0%), Arab (96.2%, a difference of 0.010%), Bermudan (96.1%, a difference of 0.010%), Pima (96.1%, a difference of 0.020%), and Spaniard (96.1%, a difference of 0.030%).
| Demographics | Rating | Rank | 7th Grade |
| Immigrants | Russia | 78.4 /100 | #152 | Good 96.2% |
| Seminole | 78.1 /100 | #153 | Good 96.2% |
| Immigrants | Israel | 77.6 /100 | #154 | Good 96.2% |
| Immigrants | Jordan | 77.0 /100 | #155 | Good 96.2% |
| Kenyans | 76.2 /100 | #156 | Good 96.2% |
| Ugandans | 75.5 /100 | #157 | Good 96.2% |
| Arabs | 68.6 /100 | #158 | Good 96.2% |
| Alsatians | 67.2 /100 | #159 | Good 96.1% |
| Immigrants | Kenya | 66.8 /100 | #160 | Good 96.1% |
| Bermudans | 66.3 /100 | #161 | Good 96.1% |
| Pima | 64.3 /100 | #162 | Good 96.1% |
| Spaniards | 62.6 /100 | #163 | Good 96.1% |
| Immigrants | Italy | 62.1 /100 | #164 | Good 96.1% |
| Immigrants | Taiwan | 61.5 /100 | #165 | Good 96.1% |
| Immigrants | Kazakhstan | 61.0 /100 | #166 | Good 96.1% |
Demographics Similar to Immigrants from Congo by 7th Grade
In terms of 7th grade, the demographic groups most similar to Immigrants from Congo are Immigrants from China (95.3%, a difference of 0.0%), Ghanaian (95.3%, a difference of 0.0%), Korean (95.3%, a difference of 0.010%), Colombian (95.3%, a difference of 0.020%), and Somali (95.3%, a difference of 0.030%).
| Demographics | Rating | Rank | 7th Grade |
| Immigrants | Cameroon | 0.9 /100 | #250 | Tragic 95.4% |
| Immigrants | Jamaica | 0.9 /100 | #251 | Tragic 95.4% |
| Immigrants | Ethiopia | 0.9 /100 | #252 | Tragic 95.3% |
| Somalis | 0.9 /100 | #253 | Tragic 95.3% |
| Colombians | 0.8 /100 | #254 | Tragic 95.3% |
| Koreans | 0.8 /100 | #255 | Tragic 95.3% |
| Immigrants | China | 0.7 /100 | #256 | Tragic 95.3% |
| Immigrants | Congo | 0.7 /100 | #257 | Tragic 95.3% |
| Ghanaians | 0.7 /100 | #258 | Tragic 95.3% |
| Immigrants | Costa Rica | 0.6 /100 | #259 | Tragic 95.3% |
| Afghans | 0.5 /100 | #260 | Tragic 95.3% |
| South Americans | 0.5 /100 | #261 | Tragic 95.2% |
| Immigrants | Somalia | 0.5 /100 | #262 | Tragic 95.2% |
| West Indians | 0.5 /100 | #263 | Tragic 95.2% |
| Immigrants | Nigeria | 0.4 /100 | #264 | Tragic 95.2% |