Haitian vs Immigrants from Congo 7th Grade
COMPARE
Haitian
Immigrants from Congo
7th Grade
7th Grade Comparison
Haitians
Immigrants from Congo
94.7%
7TH GRADE
0.0/ 100
METRIC RATING
294th/ 347
METRIC RANK
95.3%
7TH GRADE
0.7/ 100
METRIC RATING
257th/ 347
METRIC RANK
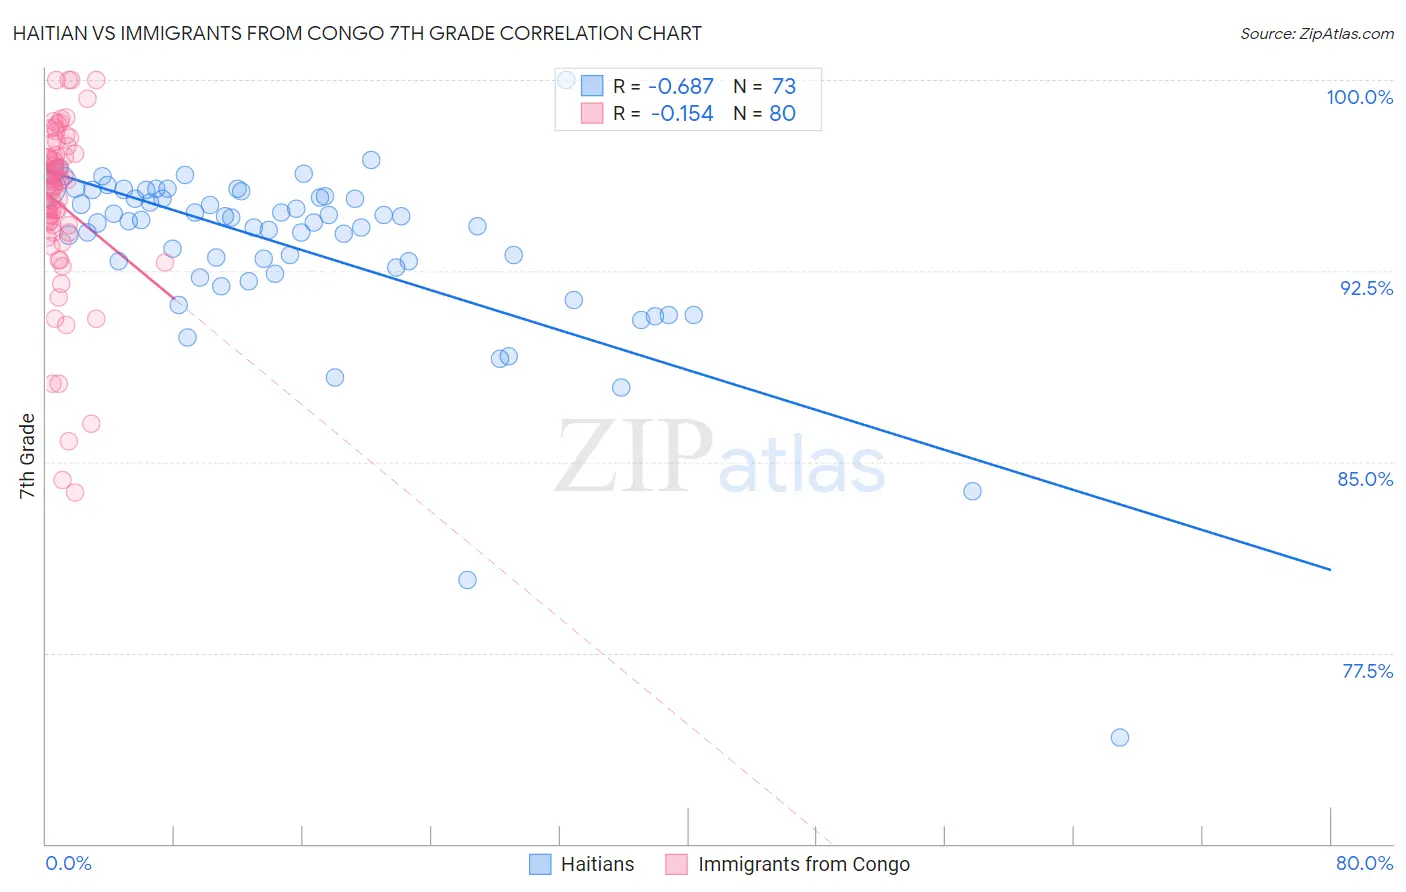
Haitian vs Immigrants from Congo 7th Grade Correlation Chart
The statistical analysis conducted on geographies consisting of 287,965,116 people shows a significant negative correlation between the proportion of Haitians and percentage of population with at least 7th grade education in the United States with a correlation coefficient (R) of -0.687 and weighted average of 94.7%. Similarly, the statistical analysis conducted on geographies consisting of 92,124,753 people shows a poor negative correlation between the proportion of Immigrants from Congo and percentage of population with at least 7th grade education in the United States with a correlation coefficient (R) of -0.154 and weighted average of 95.3%, a difference of 0.69%.
7th Grade Correlation Summary
| Measurement | Haitian | Immigrants from Congo |
| Minimum | 74.2% | 83.8% |
| Maximum | 100.0% | 100.0% |
| Range | 25.8% | 16.2% |
| Mean | 93.4% | 95.1% |
| Median | 94.5% | 95.9% |
| Interquartile 25% (IQ1) | 92.5% | 94.2% |
| Interquartile 75% (IQ3) | 95.5% | 97.0% |
| Interquartile Range (IQR) | 3.0% | 2.9% |
| Standard Deviation (Sample) | 3.7% | 3.4% |
| Standard Deviation (Population) | 3.7% | 3.4% |
Similar Demographics by 7th Grade
Demographics Similar to Haitians by 7th Grade
In terms of 7th grade, the demographic groups most similar to Haitians are Yaqui (94.6%, a difference of 0.030%), Cuban (94.6%, a difference of 0.040%), Fijian (94.7%, a difference of 0.080%), Immigrants from West Indies (94.8%, a difference of 0.10%), and Immigrants from Grenada (94.8%, a difference of 0.12%).
| Demographics | Rating | Rank | 7th Grade |
| Immigrants | Peru | 0.0 /100 | #287 | Tragic 94.9% |
| British West Indians | 0.0 /100 | #288 | Tragic 94.8% |
| Taiwanese | 0.0 /100 | #289 | Tragic 94.8% |
| Malaysians | 0.0 /100 | #290 | Tragic 94.8% |
| Immigrants | Grenada | 0.0 /100 | #291 | Tragic 94.8% |
| Immigrants | West Indies | 0.0 /100 | #292 | Tragic 94.8% |
| Fijians | 0.0 /100 | #293 | Tragic 94.7% |
| Haitians | 0.0 /100 | #294 | Tragic 94.7% |
| Yaqui | 0.0 /100 | #295 | Tragic 94.6% |
| Cubans | 0.0 /100 | #296 | Tragic 94.6% |
| Immigrants | South Eastern Asia | 0.0 /100 | #297 | Tragic 94.5% |
| Indonesians | 0.0 /100 | #298 | Tragic 94.5% |
| Bangladeshis | 0.0 /100 | #299 | Tragic 94.5% |
| Immigrants | Burma/Myanmar | 0.0 /100 | #300 | Tragic 94.5% |
| Immigrants | Dominica | 0.0 /100 | #301 | Tragic 94.5% |
Demographics Similar to Immigrants from Congo by 7th Grade
In terms of 7th grade, the demographic groups most similar to Immigrants from Congo are Immigrants from China (95.3%, a difference of 0.0%), Ghanaian (95.3%, a difference of 0.0%), Korean (95.3%, a difference of 0.010%), Colombian (95.3%, a difference of 0.020%), and Somali (95.3%, a difference of 0.030%).
| Demographics | Rating | Rank | 7th Grade |
| Immigrants | Cameroon | 0.9 /100 | #250 | Tragic 95.4% |
| Immigrants | Jamaica | 0.9 /100 | #251 | Tragic 95.4% |
| Immigrants | Ethiopia | 0.9 /100 | #252 | Tragic 95.3% |
| Somalis | 0.9 /100 | #253 | Tragic 95.3% |
| Colombians | 0.8 /100 | #254 | Tragic 95.3% |
| Koreans | 0.8 /100 | #255 | Tragic 95.3% |
| Immigrants | China | 0.7 /100 | #256 | Tragic 95.3% |
| Immigrants | Congo | 0.7 /100 | #257 | Tragic 95.3% |
| Ghanaians | 0.7 /100 | #258 | Tragic 95.3% |
| Immigrants | Costa Rica | 0.6 /100 | #259 | Tragic 95.3% |
| Afghans | 0.5 /100 | #260 | Tragic 95.3% |
| South Americans | 0.5 /100 | #261 | Tragic 95.2% |
| Immigrants | Somalia | 0.5 /100 | #262 | Tragic 95.2% |
| West Indians | 0.5 /100 | #263 | Tragic 95.2% |
| Immigrants | Nigeria | 0.4 /100 | #264 | Tragic 95.2% |