Sierra Leonean vs Immigrants from Burma/Myanmar No Schooling Completed
COMPARE
Sierra Leonean
Immigrants from Burma/Myanmar
No Schooling Completed
No Schooling Completed Comparison
Sierra Leoneans
Immigrants from Burma/Myanmar
2.3%
NO SCHOOLING COMPLETED
4.1/ 100
METRIC RATING
226th/ 347
METRIC RANK
3.1%
NO SCHOOLING COMPLETED
0.0/ 100
METRIC RATING
319th/ 347
METRIC RANK
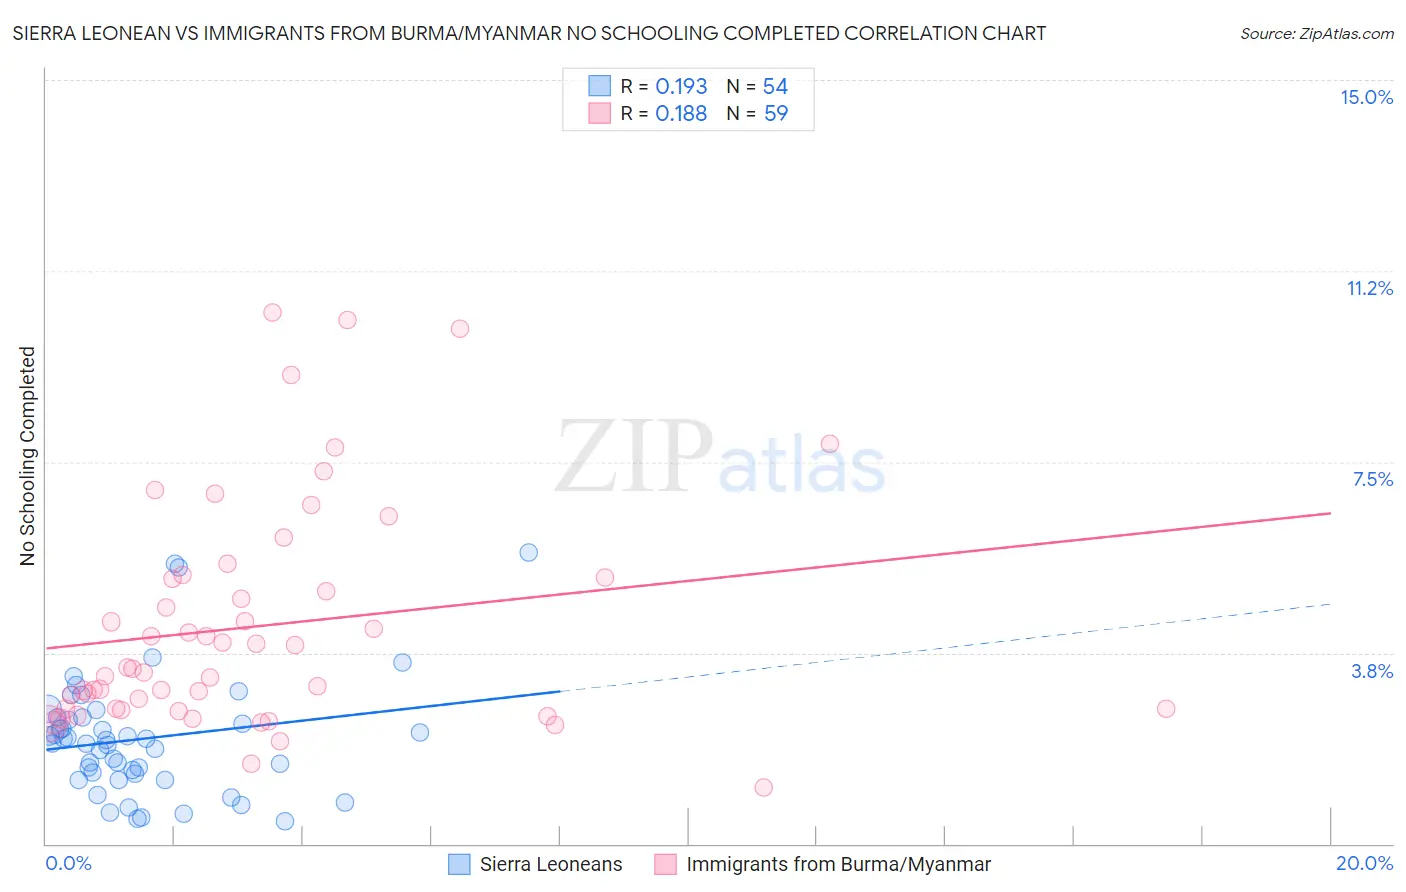
Sierra Leonean vs Immigrants from Burma/Myanmar No Schooling Completed Correlation Chart
The statistical analysis conducted on geographies consisting of 83,108,801 people shows a poor positive correlation between the proportion of Sierra Leoneans and percentage of population with no schooling in the United States with a correlation coefficient (R) of 0.193 and weighted average of 2.3%. Similarly, the statistical analysis conducted on geographies consisting of 171,802,703 people shows a poor positive correlation between the proportion of Immigrants from Burma/Myanmar and percentage of population with no schooling in the United States with a correlation coefficient (R) of 0.188 and weighted average of 3.1%, a difference of 36.0%.
No Schooling Completed Correlation Summary
| Measurement | Sierra Leonean | Immigrants from Burma/Myanmar |
| Minimum | 0.44% | 1.1% |
| Maximum | 5.7% | 10.4% |
| Range | 5.3% | 9.3% |
| Mean | 2.1% | 4.3% |
| Median | 2.0% | 3.4% |
| Interquartile 25% (IQ1) | 1.4% | 2.6% |
| Interquartile 75% (IQ3) | 2.5% | 5.2% |
| Interquartile Range (IQR) | 1.1% | 2.6% |
| Standard Deviation (Sample) | 1.2% | 2.2% |
| Standard Deviation (Population) | 1.2% | 2.2% |
Similar Demographics by No Schooling Completed
Demographics Similar to Sierra Leoneans by No Schooling Completed
In terms of no schooling completed, the demographic groups most similar to Sierra Leoneans are Sudanese (2.3%, a difference of 0.010%), Tohono O'odham (2.3%, a difference of 0.020%), Immigrants from Uganda (2.3%, a difference of 0.060%), Immigrants from Lebanon (2.3%, a difference of 0.30%), and U.S. Virgin Islander (2.3%, a difference of 0.34%).
| Demographics | Rating | Rank | No Schooling Completed |
| Senegalese | 5.6 /100 | #219 | Tragic 2.3% |
| Immigrants | Costa Rica | 5.1 /100 | #220 | Tragic 2.3% |
| Immigrants | Sudan | 5.0 /100 | #221 | Tragic 2.3% |
| Sub-Saharan Africans | 4.7 /100 | #222 | Tragic 2.3% |
| Immigrants | Lebanon | 4.5 /100 | #223 | Tragic 2.3% |
| Tohono O'odham | 4.1 /100 | #224 | Tragic 2.3% |
| Sudanese | 4.1 /100 | #225 | Tragic 2.3% |
| Sierra Leoneans | 4.1 /100 | #226 | Tragic 2.3% |
| Immigrants | Uganda | 4.0 /100 | #227 | Tragic 2.3% |
| U.S. Virgin Islanders | 3.7 /100 | #228 | Tragic 2.3% |
| Immigrants | Pakistan | 3.6 /100 | #229 | Tragic 2.3% |
| Puerto Ricans | 3.4 /100 | #230 | Tragic 2.3% |
| Immigrants | Uruguay | 3.4 /100 | #231 | Tragic 2.3% |
| Colombians | 3.2 /100 | #232 | Tragic 2.3% |
| Immigrants | Malaysia | 2.8 /100 | #233 | Tragic 2.3% |
Demographics Similar to Immigrants from Burma/Myanmar by No Schooling Completed
In terms of no schooling completed, the demographic groups most similar to Immigrants from Burma/Myanmar are Immigrants from Bangladesh (3.1%, a difference of 0.040%), Immigrants from Laos (3.1%, a difference of 0.15%), Immigrants from Guyana (3.1%, a difference of 0.74%), Immigrants from Honduras (3.2%, a difference of 0.83%), and Vietnamese (3.2%, a difference of 1.0%).
| Demographics | Rating | Rank | No Schooling Completed |
| Sri Lankans | 0.0 /100 | #312 | Tragic 3.0% |
| Hondurans | 0.0 /100 | #313 | Tragic 3.1% |
| Immigrants | Belize | 0.0 /100 | #314 | Tragic 3.1% |
| Immigrants | Nicaragua | 0.0 /100 | #315 | Tragic 3.1% |
| Immigrants | Ecuador | 0.0 /100 | #316 | Tragic 3.1% |
| Cape Verdeans | 0.0 /100 | #317 | Tragic 3.1% |
| Immigrants | Guyana | 0.0 /100 | #318 | Tragic 3.1% |
| Immigrants | Burma/Myanmar | 0.0 /100 | #319 | Tragic 3.1% |
| Immigrants | Bangladesh | 0.0 /100 | #320 | Tragic 3.1% |
| Immigrants | Laos | 0.0 /100 | #321 | Tragic 3.1% |
| Immigrants | Honduras | 0.0 /100 | #322 | Tragic 3.2% |
| Vietnamese | 0.0 /100 | #323 | Tragic 3.2% |
| Mexican American Indians | 0.0 /100 | #324 | Tragic 3.2% |
| Dominicans | 0.0 /100 | #325 | Tragic 3.2% |
| Indonesians | 0.0 /100 | #326 | Tragic 3.2% |