Northern European vs Immigrants from Burma/Myanmar No Schooling Completed
COMPARE
Northern European
Immigrants from Burma/Myanmar
No Schooling Completed
No Schooling Completed Comparison
Northern Europeans
Immigrants from Burma/Myanmar
1.6%
NO SCHOOLING COMPLETED
99.9/ 100
METRIC RATING
38th/ 347
METRIC RANK
3.1%
NO SCHOOLING COMPLETED
0.0/ 100
METRIC RATING
319th/ 347
METRIC RANK
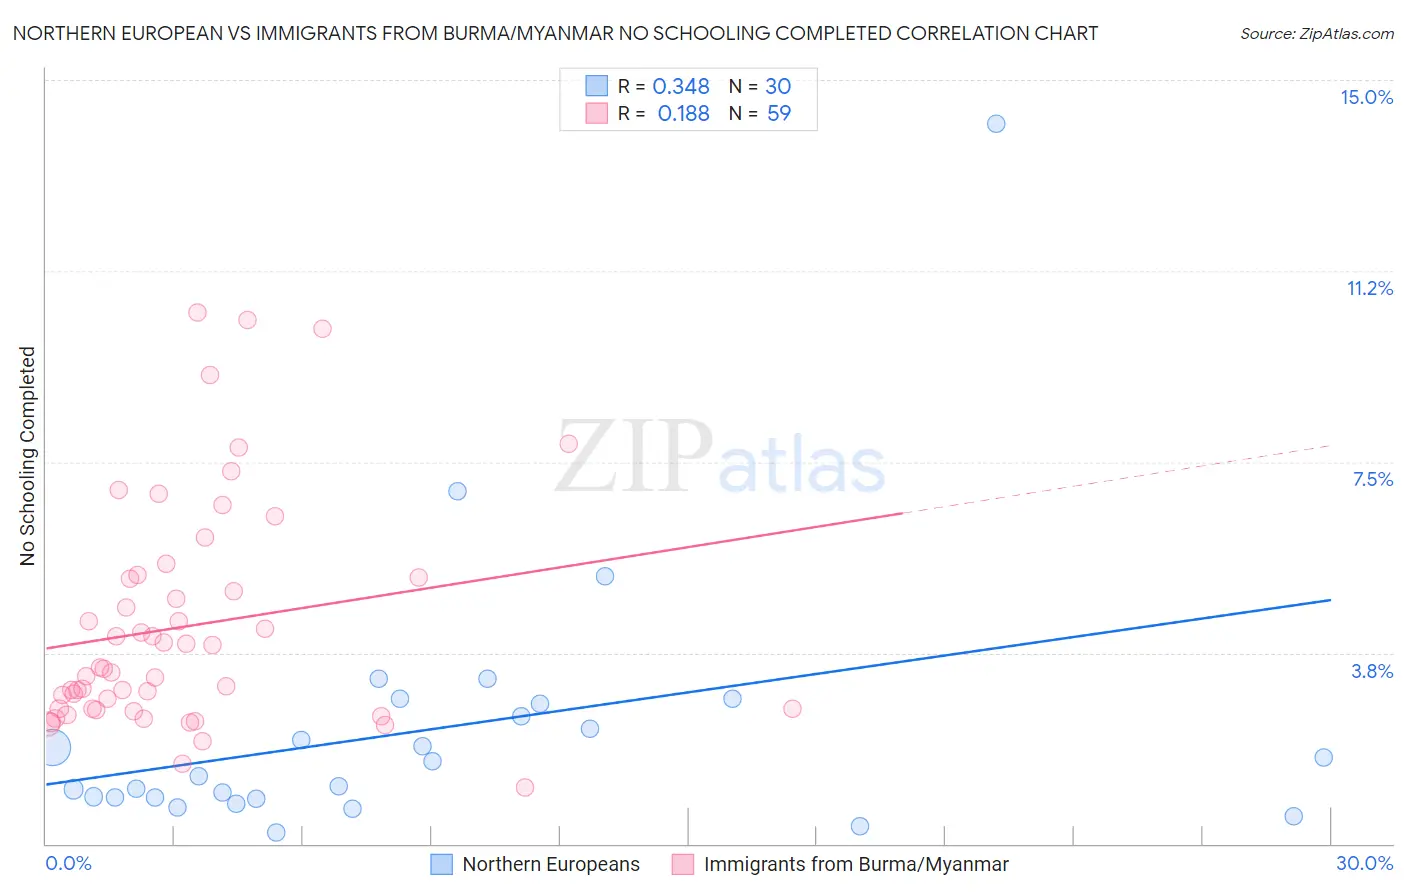
Northern European vs Immigrants from Burma/Myanmar No Schooling Completed Correlation Chart
The statistical analysis conducted on geographies consisting of 399,870,964 people shows a mild positive correlation between the proportion of Northern Europeans and percentage of population with no schooling in the United States with a correlation coefficient (R) of 0.348 and weighted average of 1.6%. Similarly, the statistical analysis conducted on geographies consisting of 171,802,703 people shows a poor positive correlation between the proportion of Immigrants from Burma/Myanmar and percentage of population with no schooling in the United States with a correlation coefficient (R) of 0.188 and weighted average of 3.1%, a difference of 99.2%.
No Schooling Completed Correlation Summary
| Measurement | Northern European | Immigrants from Burma/Myanmar |
| Minimum | 0.21% | 1.1% |
| Maximum | 14.1% | 10.4% |
| Range | 13.9% | 9.3% |
| Mean | 2.3% | 4.3% |
| Median | 1.5% | 3.4% |
| Interquartile 25% (IQ1) | 0.90% | 2.6% |
| Interquartile 75% (IQ3) | 2.8% | 5.2% |
| Interquartile Range (IQR) | 1.8% | 2.6% |
| Standard Deviation (Sample) | 2.7% | 2.2% |
| Standard Deviation (Population) | 2.6% | 2.2% |
Similar Demographics by No Schooling Completed
Demographics Similar to Northern Europeans by No Schooling Completed
In terms of no schooling completed, the demographic groups most similar to Northern Europeans are Belgian (1.6%, a difference of 0.13%), Native Hawaiian (1.6%, a difference of 0.27%), Aleut (1.6%, a difference of 0.40%), Luxembourger (1.6%, a difference of 0.61%), and Hungarian (1.6%, a difference of 0.89%).
| Demographics | Rating | Rank | No Schooling Completed |
| Inupiat | 100.0 /100 | #31 | Exceptional 1.5% |
| Swiss | 100.0 /100 | #32 | Exceptional 1.5% |
| Italians | 100.0 /100 | #33 | Exceptional 1.5% |
| Latvians | 100.0 /100 | #34 | Exceptional 1.5% |
| Eastern Europeans | 100.0 /100 | #35 | Exceptional 1.6% |
| Aleuts | 99.9 /100 | #36 | Exceptional 1.6% |
| Belgians | 99.9 /100 | #37 | Exceptional 1.6% |
| Northern Europeans | 99.9 /100 | #38 | Exceptional 1.6% |
| Native Hawaiians | 99.9 /100 | #39 | Exceptional 1.6% |
| Luxembourgers | 99.9 /100 | #40 | Exceptional 1.6% |
| Hungarians | 99.9 /100 | #41 | Exceptional 1.6% |
| Bulgarians | 99.9 /100 | #42 | Exceptional 1.6% |
| Australians | 99.9 /100 | #43 | Exceptional 1.6% |
| Estonians | 99.9 /100 | #44 | Exceptional 1.6% |
| Czechoslovakians | 99.9 /100 | #45 | Exceptional 1.6% |
Demographics Similar to Immigrants from Burma/Myanmar by No Schooling Completed
In terms of no schooling completed, the demographic groups most similar to Immigrants from Burma/Myanmar are Immigrants from Bangladesh (3.1%, a difference of 0.040%), Immigrants from Laos (3.1%, a difference of 0.15%), Immigrants from Guyana (3.1%, a difference of 0.74%), Immigrants from Honduras (3.2%, a difference of 0.83%), and Vietnamese (3.2%, a difference of 1.0%).
| Demographics | Rating | Rank | No Schooling Completed |
| Sri Lankans | 0.0 /100 | #312 | Tragic 3.0% |
| Hondurans | 0.0 /100 | #313 | Tragic 3.1% |
| Immigrants | Belize | 0.0 /100 | #314 | Tragic 3.1% |
| Immigrants | Nicaragua | 0.0 /100 | #315 | Tragic 3.1% |
| Immigrants | Ecuador | 0.0 /100 | #316 | Tragic 3.1% |
| Cape Verdeans | 0.0 /100 | #317 | Tragic 3.1% |
| Immigrants | Guyana | 0.0 /100 | #318 | Tragic 3.1% |
| Immigrants | Burma/Myanmar | 0.0 /100 | #319 | Tragic 3.1% |
| Immigrants | Bangladesh | 0.0 /100 | #320 | Tragic 3.1% |
| Immigrants | Laos | 0.0 /100 | #321 | Tragic 3.1% |
| Immigrants | Honduras | 0.0 /100 | #322 | Tragic 3.2% |
| Vietnamese | 0.0 /100 | #323 | Tragic 3.2% |
| Mexican American Indians | 0.0 /100 | #324 | Tragic 3.2% |
| Dominicans | 0.0 /100 | #325 | Tragic 3.2% |
| Indonesians | 0.0 /100 | #326 | Tragic 3.2% |