Sierra Leonean vs Native Hawaiian No Schooling Completed
COMPARE
Sierra Leonean
Native Hawaiian
No Schooling Completed
No Schooling Completed Comparison
Sierra Leoneans
Native Hawaiians
2.3%
NO SCHOOLING COMPLETED
4.1/ 100
METRIC RATING
226th/ 347
METRIC RANK
1.6%
NO SCHOOLING COMPLETED
99.9/ 100
METRIC RATING
39th/ 347
METRIC RANK
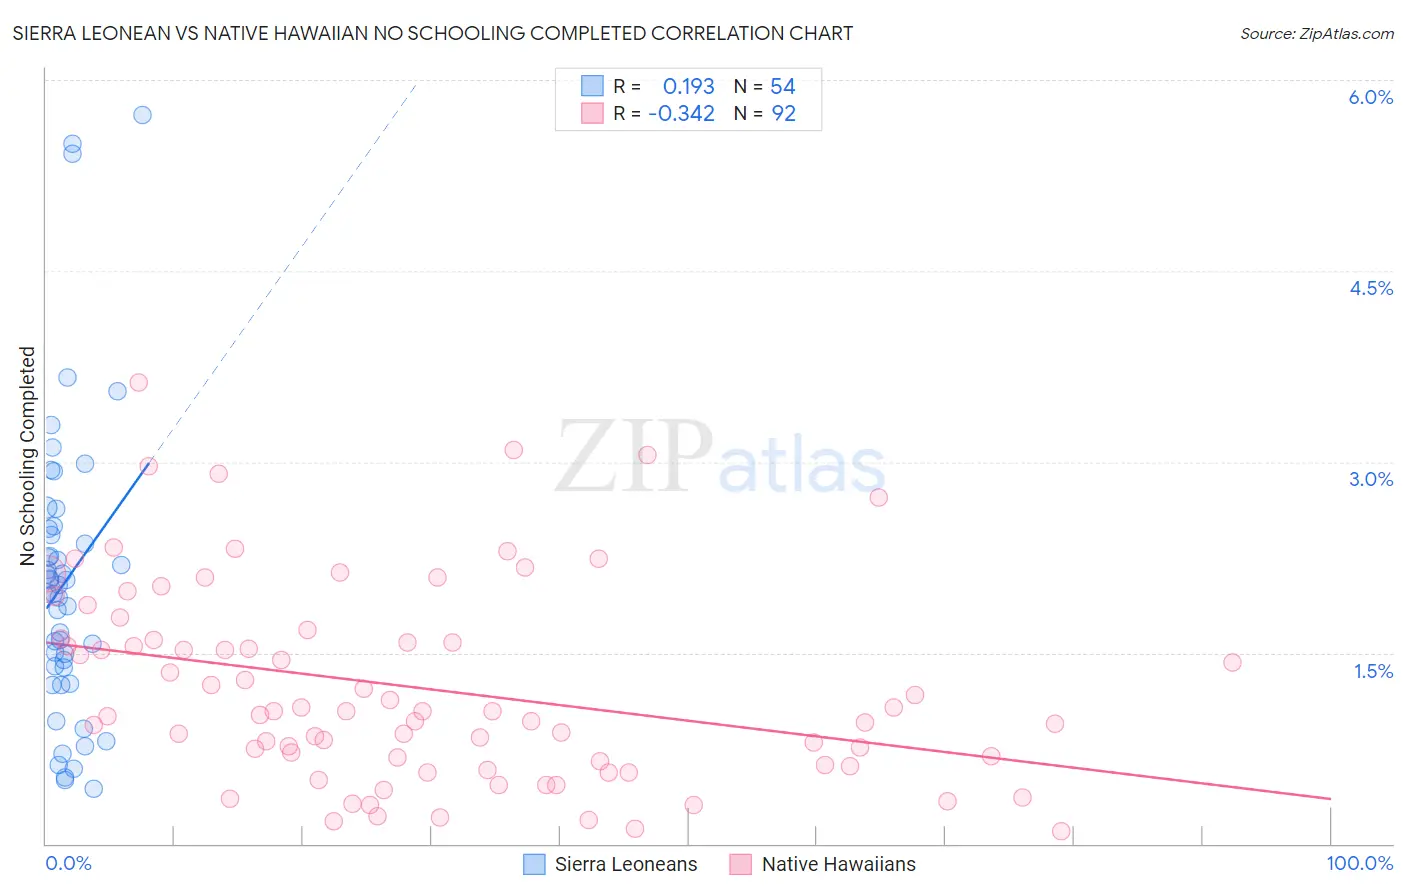
Sierra Leonean vs Native Hawaiian No Schooling Completed Correlation Chart
The statistical analysis conducted on geographies consisting of 83,108,801 people shows a poor positive correlation between the proportion of Sierra Leoneans and percentage of population with no schooling in the United States with a correlation coefficient (R) of 0.193 and weighted average of 2.3%. Similarly, the statistical analysis conducted on geographies consisting of 328,857,957 people shows a mild negative correlation between the proportion of Native Hawaiians and percentage of population with no schooling in the United States with a correlation coefficient (R) of -0.342 and weighted average of 1.6%, a difference of 46.1%.
No Schooling Completed Correlation Summary
| Measurement | Sierra Leonean | Native Hawaiian |
| Minimum | 0.44% | 0.093% |
| Maximum | 5.7% | 3.6% |
| Range | 5.3% | 3.5% |
| Mean | 2.1% | 1.2% |
| Median | 2.0% | 1.0% |
| Interquartile 25% (IQ1) | 1.4% | 0.63% |
| Interquartile 75% (IQ3) | 2.5% | 1.6% |
| Interquartile Range (IQR) | 1.1% | 0.97% |
| Standard Deviation (Sample) | 1.2% | 0.78% |
| Standard Deviation (Population) | 1.2% | 0.77% |
Similar Demographics by No Schooling Completed
Demographics Similar to Sierra Leoneans by No Schooling Completed
In terms of no schooling completed, the demographic groups most similar to Sierra Leoneans are Sudanese (2.3%, a difference of 0.010%), Tohono O'odham (2.3%, a difference of 0.020%), Immigrants from Uganda (2.3%, a difference of 0.060%), Immigrants from Lebanon (2.3%, a difference of 0.30%), and U.S. Virgin Islander (2.3%, a difference of 0.34%).
| Demographics | Rating | Rank | No Schooling Completed |
| Senegalese | 5.6 /100 | #219 | Tragic 2.3% |
| Immigrants | Costa Rica | 5.1 /100 | #220 | Tragic 2.3% |
| Immigrants | Sudan | 5.0 /100 | #221 | Tragic 2.3% |
| Sub-Saharan Africans | 4.7 /100 | #222 | Tragic 2.3% |
| Immigrants | Lebanon | 4.5 /100 | #223 | Tragic 2.3% |
| Tohono O'odham | 4.1 /100 | #224 | Tragic 2.3% |
| Sudanese | 4.1 /100 | #225 | Tragic 2.3% |
| Sierra Leoneans | 4.1 /100 | #226 | Tragic 2.3% |
| Immigrants | Uganda | 4.0 /100 | #227 | Tragic 2.3% |
| U.S. Virgin Islanders | 3.7 /100 | #228 | Tragic 2.3% |
| Immigrants | Pakistan | 3.6 /100 | #229 | Tragic 2.3% |
| Puerto Ricans | 3.4 /100 | #230 | Tragic 2.3% |
| Immigrants | Uruguay | 3.4 /100 | #231 | Tragic 2.3% |
| Colombians | 3.2 /100 | #232 | Tragic 2.3% |
| Immigrants | Malaysia | 2.8 /100 | #233 | Tragic 2.3% |
Demographics Similar to Native Hawaiians by No Schooling Completed
In terms of no schooling completed, the demographic groups most similar to Native Hawaiians are Northern European (1.6%, a difference of 0.27%), Luxembourger (1.6%, a difference of 0.35%), Belgian (1.6%, a difference of 0.40%), Hungarian (1.6%, a difference of 0.62%), and Aleut (1.6%, a difference of 0.67%).
| Demographics | Rating | Rank | No Schooling Completed |
| Swiss | 100.0 /100 | #32 | Exceptional 1.5% |
| Italians | 100.0 /100 | #33 | Exceptional 1.5% |
| Latvians | 100.0 /100 | #34 | Exceptional 1.5% |
| Eastern Europeans | 100.0 /100 | #35 | Exceptional 1.6% |
| Aleuts | 99.9 /100 | #36 | Exceptional 1.6% |
| Belgians | 99.9 /100 | #37 | Exceptional 1.6% |
| Northern Europeans | 99.9 /100 | #38 | Exceptional 1.6% |
| Native Hawaiians | 99.9 /100 | #39 | Exceptional 1.6% |
| Luxembourgers | 99.9 /100 | #40 | Exceptional 1.6% |
| Hungarians | 99.9 /100 | #41 | Exceptional 1.6% |
| Bulgarians | 99.9 /100 | #42 | Exceptional 1.6% |
| Australians | 99.9 /100 | #43 | Exceptional 1.6% |
| Estonians | 99.9 /100 | #44 | Exceptional 1.6% |
| Czechoslovakians | 99.9 /100 | #45 | Exceptional 1.6% |
| Maltese | 99.9 /100 | #46 | Exceptional 1.6% |