Haitian vs Immigrants from Burma/Myanmar No Schooling Completed
COMPARE
Haitian
Immigrants from Burma/Myanmar
No Schooling Completed
No Schooling Completed Comparison
Haitians
Immigrants from Burma/Myanmar
2.9%
NO SCHOOLING COMPLETED
0.0/ 100
METRIC RATING
300th/ 347
METRIC RANK
3.1%
NO SCHOOLING COMPLETED
0.0/ 100
METRIC RATING
319th/ 347
METRIC RANK
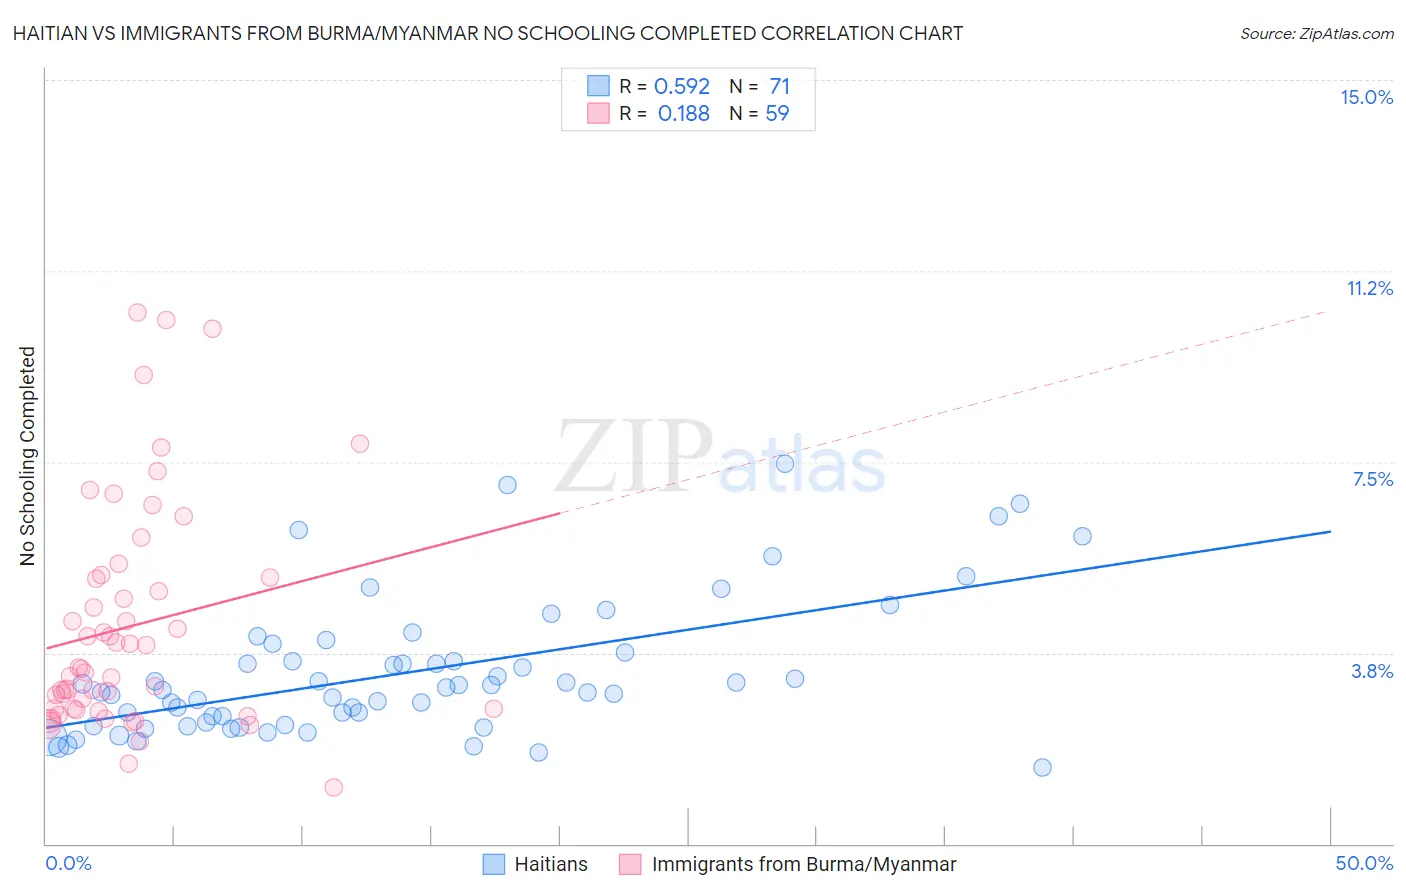
Haitian vs Immigrants from Burma/Myanmar No Schooling Completed Correlation Chart
The statistical analysis conducted on geographies consisting of 286,255,737 people shows a substantial positive correlation between the proportion of Haitians and percentage of population with no schooling in the United States with a correlation coefficient (R) of 0.592 and weighted average of 2.9%. Similarly, the statistical analysis conducted on geographies consisting of 171,802,703 people shows a poor positive correlation between the proportion of Immigrants from Burma/Myanmar and percentage of population with no schooling in the United States with a correlation coefficient (R) of 0.188 and weighted average of 3.1%, a difference of 10.2%.
No Schooling Completed Correlation Summary
| Measurement | Haitian | Immigrants from Burma/Myanmar |
| Minimum | 1.5% | 1.1% |
| Maximum | 7.5% | 10.4% |
| Range | 6.0% | 9.3% |
| Mean | 3.4% | 4.3% |
| Median | 3.0% | 3.4% |
| Interquartile 25% (IQ1) | 2.3% | 2.6% |
| Interquartile 75% (IQ3) | 3.8% | 5.2% |
| Interquartile Range (IQR) | 1.4% | 2.6% |
| Standard Deviation (Sample) | 1.3% | 2.2% |
| Standard Deviation (Population) | 1.3% | 2.2% |
Demographics Similar to Haitians and Immigrants from Burma/Myanmar by No Schooling Completed
In terms of no schooling completed, the demographic groups most similar to Haitians are Central American Indian (2.8%, a difference of 0.31%), Immigrants from South Eastern Asia (2.9%, a difference of 1.5%), Immigrants from Caribbean (2.9%, a difference of 1.9%), Somali (2.9%, a difference of 2.9%), and Nicaraguan (2.9%, a difference of 3.1%). Similarly, the demographic groups most similar to Immigrants from Burma/Myanmar are Immigrants from Guyana (3.1%, a difference of 0.74%), Cape Verdean (3.1%, a difference of 1.4%), Immigrants from Ecuador (3.1%, a difference of 1.9%), Immigrants from Nicaragua (3.1%, a difference of 2.3%), and Immigrants from Belize (3.1%, a difference of 2.5%).
| Demographics | Rating | Rank | No Schooling Completed |
| Central American Indians | 0.0 /100 | #299 | Tragic 2.8% |
| Haitians | 0.0 /100 | #300 | Tragic 2.9% |
| Immigrants | South Eastern Asia | 0.0 /100 | #301 | Tragic 2.9% |
| Immigrants | Caribbean | 0.0 /100 | #302 | Tragic 2.9% |
| Somalis | 0.0 /100 | #303 | Tragic 2.9% |
| Nicaraguans | 0.0 /100 | #304 | Tragic 2.9% |
| Ecuadorians | 0.0 /100 | #305 | Tragic 3.0% |
| Belizeans | 0.0 /100 | #306 | Tragic 3.0% |
| Immigrants | Haiti | 0.0 /100 | #307 | Tragic 3.0% |
| Immigrants | Somalia | 0.0 /100 | #308 | Tragic 3.0% |
| Hispanics or Latinos | 0.0 /100 | #309 | Tragic 3.0% |
| Guyanese | 0.0 /100 | #310 | Tragic 3.0% |
| Immigrants | Azores | 0.0 /100 | #311 | Tragic 3.0% |
| Sri Lankans | 0.0 /100 | #312 | Tragic 3.0% |
| Hondurans | 0.0 /100 | #313 | Tragic 3.1% |
| Immigrants | Belize | 0.0 /100 | #314 | Tragic 3.1% |
| Immigrants | Nicaragua | 0.0 /100 | #315 | Tragic 3.1% |
| Immigrants | Ecuador | 0.0 /100 | #316 | Tragic 3.1% |
| Cape Verdeans | 0.0 /100 | #317 | Tragic 3.1% |
| Immigrants | Guyana | 0.0 /100 | #318 | Tragic 3.1% |
| Immigrants | Burma/Myanmar | 0.0 /100 | #319 | Tragic 3.1% |