Carpatho Rusyn vs English GED/Equivalency
COMPARE
Carpatho Rusyn
English
GED/Equivalency
GED/Equivalency Comparison
Carpatho Rusyns
English
89.1%
GED/EQUIVALENCY
99.9/ 100
METRIC RATING
8th/ 347
METRIC RANK
87.6%
GED/EQUIVALENCY
98.6/ 100
METRIC RATING
79th/ 347
METRIC RANK
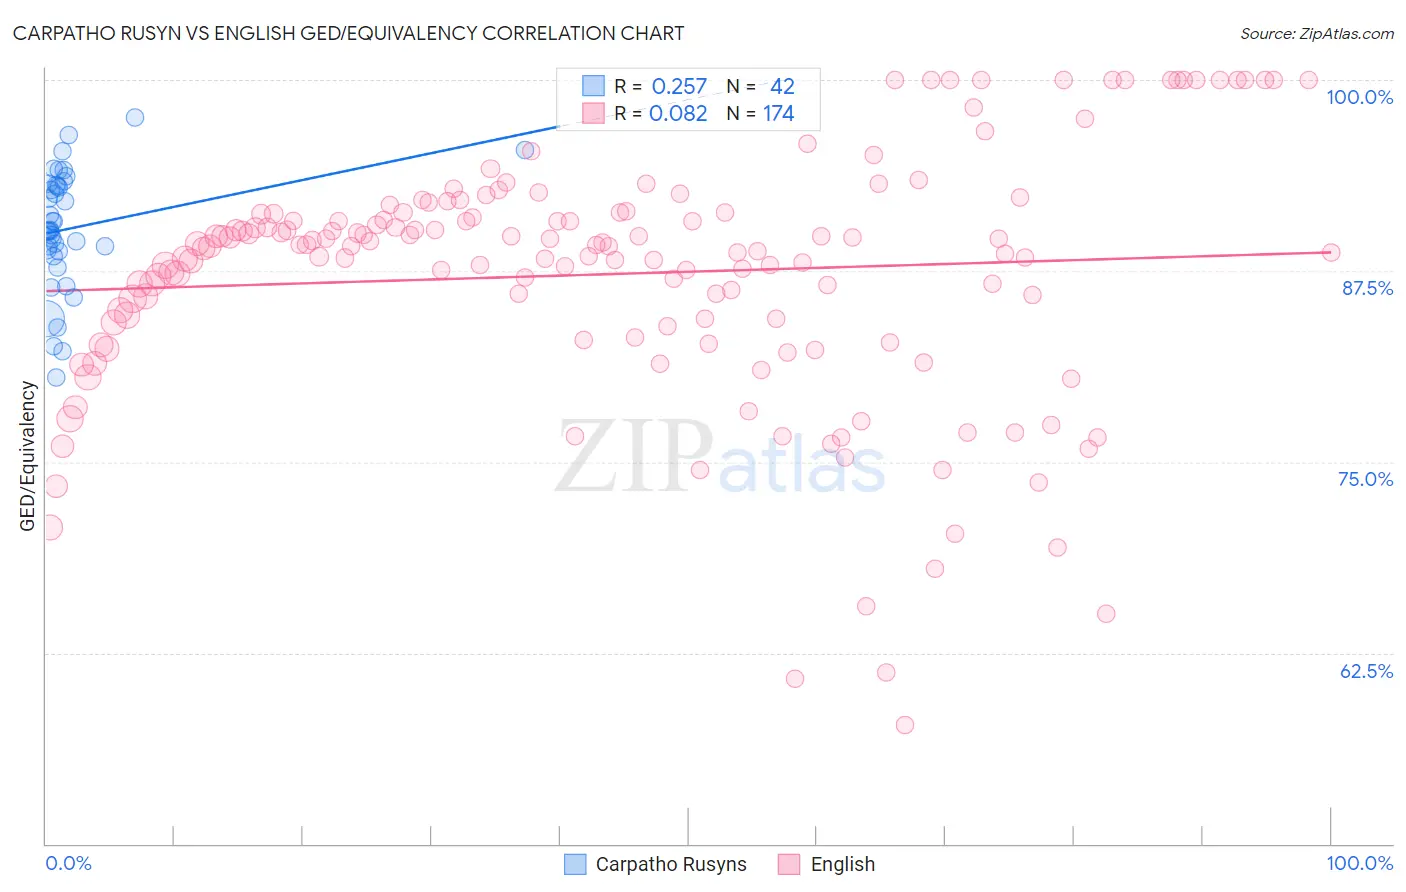
Carpatho Rusyn vs English GED/Equivalency Correlation Chart
The statistical analysis conducted on geographies consisting of 58,871,690 people shows a weak positive correlation between the proportion of Carpatho Rusyns and percentage of population with at least ged/equivalency education in the United States with a correlation coefficient (R) of 0.257 and weighted average of 89.1%. Similarly, the statistical analysis conducted on geographies consisting of 579,979,946 people shows a slight positive correlation between the proportion of English and percentage of population with at least ged/equivalency education in the United States with a correlation coefficient (R) of 0.082 and weighted average of 87.6%, a difference of 1.7%.
GED/Equivalency Correlation Summary
| Measurement | Carpatho Rusyn | English |
| Minimum | 80.5% | 57.8% |
| Maximum | 97.5% | 100.0% |
| Range | 17.0% | 42.2% |
| Mean | 90.3% | 87.3% |
| Median | 90.2% | 89.1% |
| Interquartile 25% (IQ1) | 88.8% | 83.9% |
| Interquartile 75% (IQ3) | 93.2% | 91.2% |
| Interquartile Range (IQR) | 4.3% | 7.3% |
| Standard Deviation (Sample) | 3.9% | 8.1% |
| Standard Deviation (Population) | 3.9% | 8.1% |
Similar Demographics by GED/Equivalency
Demographics Similar to Carpatho Rusyns by GED/Equivalency
In terms of ged/equivalency, the demographic groups most similar to Carpatho Rusyns are Chinese (89.0%, a difference of 0.020%), Eastern European (89.1%, a difference of 0.050%), Norwegian (89.0%, a difference of 0.070%), Thai (89.1%, a difference of 0.090%), and Bulgarian (89.0%, a difference of 0.10%).
| Demographics | Rating | Rank | GED/Equivalency |
| Immigrants | India | 100.0 /100 | #1 | Exceptional 89.7% |
| Filipinos | 100.0 /100 | #2 | Exceptional 89.5% |
| Immigrants | Singapore | 100.0 /100 | #3 | Exceptional 89.3% |
| Iranians | 100.0 /100 | #4 | Exceptional 89.2% |
| Latvians | 100.0 /100 | #5 | Exceptional 89.2% |
| Thais | 100.0 /100 | #6 | Exceptional 89.1% |
| Eastern Europeans | 99.9 /100 | #7 | Exceptional 89.1% |
| Carpatho Rusyns | 99.9 /100 | #8 | Exceptional 89.1% |
| Chinese | 99.9 /100 | #9 | Exceptional 89.0% |
| Norwegians | 99.9 /100 | #10 | Exceptional 89.0% |
| Bulgarians | 99.9 /100 | #11 | Exceptional 89.0% |
| Lithuanians | 99.9 /100 | #12 | Exceptional 88.9% |
| Immigrants | Iran | 99.9 /100 | #13 | Exceptional 88.9% |
| Cypriots | 99.9 /100 | #14 | Exceptional 88.9% |
| Okinawans | 99.9 /100 | #15 | Exceptional 88.9% |
Demographics Similar to English by GED/Equivalency
In terms of ged/equivalency, the demographic groups most similar to English are Irish (87.6%, a difference of 0.030%), Immigrants from England (87.6%, a difference of 0.030%), Immigrants from Serbia (87.7%, a difference of 0.050%), Slavic (87.7%, a difference of 0.050%), and Scottish (87.7%, a difference of 0.070%).
| Demographics | Rating | Rank | GED/Equivalency |
| Immigrants | Moldova | 98.8 /100 | #72 | Exceptional 87.7% |
| Belgians | 98.8 /100 | #73 | Exceptional 87.7% |
| Immigrants | Kuwait | 98.8 /100 | #74 | Exceptional 87.7% |
| Scottish | 98.7 /100 | #75 | Exceptional 87.7% |
| Immigrants | Serbia | 98.7 /100 | #76 | Exceptional 87.7% |
| Slavs | 98.7 /100 | #77 | Exceptional 87.7% |
| Irish | 98.6 /100 | #78 | Exceptional 87.6% |
| English | 98.6 /100 | #79 | Exceptional 87.6% |
| Immigrants | England | 98.5 /100 | #80 | Exceptional 87.6% |
| Immigrants | Sri Lanka | 98.3 /100 | #81 | Exceptional 87.5% |
| Romanians | 98.3 /100 | #82 | Exceptional 87.5% |
| South Africans | 98.3 /100 | #83 | Exceptional 87.5% |
| Immigrants | Romania | 98.1 /100 | #84 | Exceptional 87.5% |
| Dutch | 98.1 /100 | #85 | Exceptional 87.5% |
| Immigrants | Europe | 98.1 /100 | #86 | Exceptional 87.5% |