Nonimmigrants vs English GED/Equivalency
COMPARE
Nonimmigrants
English
GED/Equivalency
GED/Equivalency Comparison
Nonimmigrants
English
85.2%
GED/EQUIVALENCY
22.7/ 100
METRIC RATING
192nd/ 347
METRIC RANK
87.6%
GED/EQUIVALENCY
98.6/ 100
METRIC RATING
79th/ 347
METRIC RANK
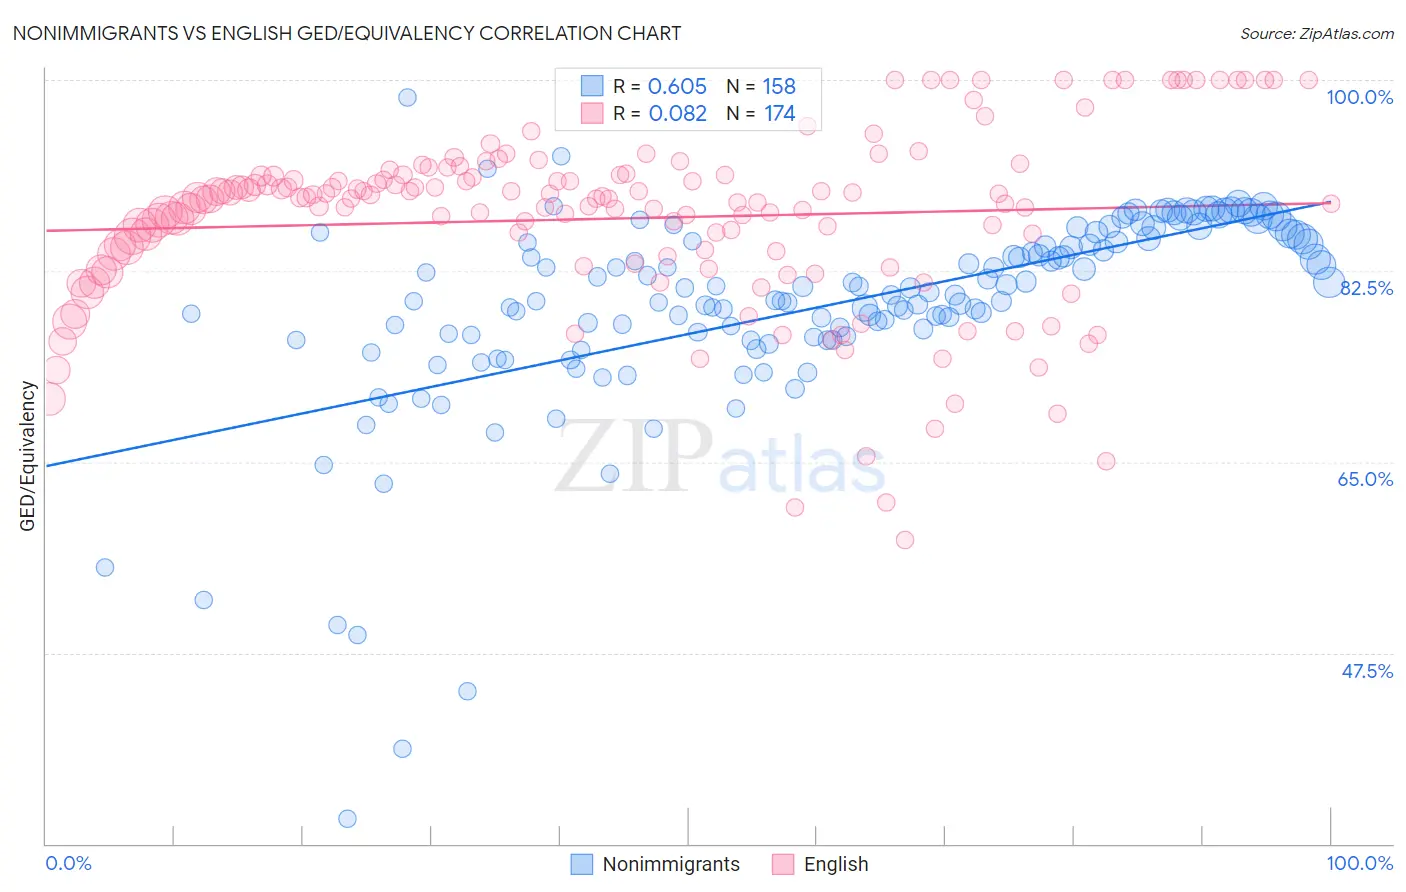
Nonimmigrants vs English GED/Equivalency Correlation Chart
The statistical analysis conducted on geographies consisting of 585,366,948 people shows a significant positive correlation between the proportion of Nonimmigrants and percentage of population with at least ged/equivalency education in the United States with a correlation coefficient (R) of 0.605 and weighted average of 85.2%. Similarly, the statistical analysis conducted on geographies consisting of 579,979,946 people shows a slight positive correlation between the proportion of English and percentage of population with at least ged/equivalency education in the United States with a correlation coefficient (R) of 0.082 and weighted average of 87.6%, a difference of 2.8%.
GED/Equivalency Correlation Summary
| Measurement | Nonimmigrants | English |
| Minimum | 32.3% | 57.8% |
| Maximum | 98.4% | 100.0% |
| Range | 66.2% | 42.2% |
| Mean | 79.2% | 87.3% |
| Median | 80.3% | 89.1% |
| Interquartile 25% (IQ1) | 76.4% | 83.9% |
| Interquartile 75% (IQ3) | 85.3% | 91.2% |
| Interquartile Range (IQR) | 8.8% | 7.3% |
| Standard Deviation (Sample) | 9.4% | 8.1% |
| Standard Deviation (Population) | 9.4% | 8.1% |
Similar Demographics by GED/Equivalency
Demographics Similar to Nonimmigrants by GED/Equivalency
In terms of ged/equivalency, the demographic groups most similar to Nonimmigrants are South American Indian (85.2%, a difference of 0.0%), Delaware (85.2%, a difference of 0.010%), Puget Sound Salish (85.2%, a difference of 0.060%), Chippewa (85.2%, a difference of 0.060%), and Tongan (85.2%, a difference of 0.060%).
| Demographics | Rating | Rank | GED/Equivalency |
| Spanish | 32.8 /100 | #185 | Fair 85.4% |
| Spaniards | 31.9 /100 | #186 | Fair 85.4% |
| Immigrants | Afghanistan | 29.8 /100 | #187 | Fair 85.4% |
| Immigrants | Sierra Leone | 29.0 /100 | #188 | Fair 85.4% |
| Guamanians/Chamorros | 28.4 /100 | #189 | Fair 85.3% |
| Alaskan Athabascans | 27.5 /100 | #190 | Fair 85.3% |
| South American Indians | 22.8 /100 | #191 | Fair 85.2% |
| Immigrants | Nonimmigrants | 22.7 /100 | #192 | Fair 85.2% |
| Delaware | 22.2 /100 | #193 | Fair 85.2% |
| Puget Sound Salish | 20.8 /100 | #194 | Fair 85.2% |
| Chippewa | 20.8 /100 | #195 | Fair 85.2% |
| Tongans | 20.7 /100 | #196 | Fair 85.2% |
| Costa Ricans | 20.4 /100 | #197 | Fair 85.2% |
| Immigrants | Africa | 17.5 /100 | #198 | Poor 85.1% |
| Somalis | 16.4 /100 | #199 | Poor 85.0% |
Demographics Similar to English by GED/Equivalency
In terms of ged/equivalency, the demographic groups most similar to English are Irish (87.6%, a difference of 0.030%), Immigrants from England (87.6%, a difference of 0.030%), Immigrants from Serbia (87.7%, a difference of 0.050%), Slavic (87.7%, a difference of 0.050%), and Scottish (87.7%, a difference of 0.070%).
| Demographics | Rating | Rank | GED/Equivalency |
| Immigrants | Moldova | 98.8 /100 | #72 | Exceptional 87.7% |
| Belgians | 98.8 /100 | #73 | Exceptional 87.7% |
| Immigrants | Kuwait | 98.8 /100 | #74 | Exceptional 87.7% |
| Scottish | 98.7 /100 | #75 | Exceptional 87.7% |
| Immigrants | Serbia | 98.7 /100 | #76 | Exceptional 87.7% |
| Slavs | 98.7 /100 | #77 | Exceptional 87.7% |
| Irish | 98.6 /100 | #78 | Exceptional 87.6% |
| English | 98.6 /100 | #79 | Exceptional 87.6% |
| Immigrants | England | 98.5 /100 | #80 | Exceptional 87.6% |
| Immigrants | Sri Lanka | 98.3 /100 | #81 | Exceptional 87.5% |
| Romanians | 98.3 /100 | #82 | Exceptional 87.5% |
| South Africans | 98.3 /100 | #83 | Exceptional 87.5% |
| Immigrants | Romania | 98.1 /100 | #84 | Exceptional 87.5% |
| Dutch | 98.1 /100 | #85 | Exceptional 87.5% |
| Immigrants | Europe | 98.1 /100 | #86 | Exceptional 87.5% |