Seminole vs Immigrants from Grenada 10th Grade
COMPARE
Seminole
Immigrants from Grenada
10th Grade
10th Grade Comparison
Seminole
Immigrants from Grenada
93.3%
10TH GRADE
10.2/ 100
METRIC RATING
219th/ 347
METRIC RANK
91.6%
10TH GRADE
0.0/ 100
METRIC RATING
296th/ 347
METRIC RANK
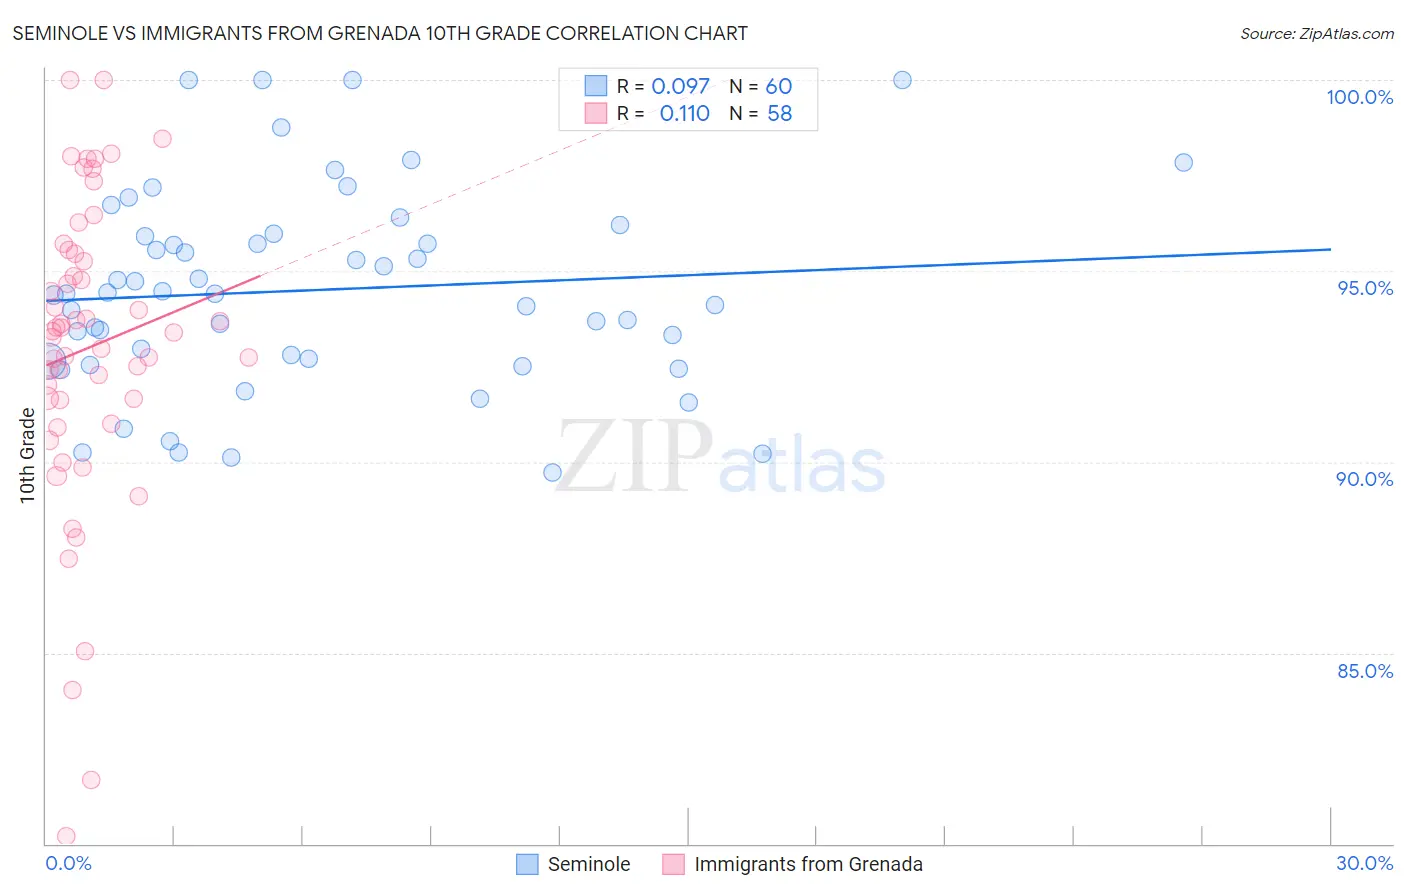
Seminole vs Immigrants from Grenada 10th Grade Correlation Chart
The statistical analysis conducted on geographies consisting of 118,314,042 people shows a slight positive correlation between the proportion of Seminole and percentage of population with at least 10th grade education in the United States with a correlation coefficient (R) of 0.097 and weighted average of 93.3%. Similarly, the statistical analysis conducted on geographies consisting of 67,199,790 people shows a poor positive correlation between the proportion of Immigrants from Grenada and percentage of population with at least 10th grade education in the United States with a correlation coefficient (R) of 0.110 and weighted average of 91.6%, a difference of 1.8%.
10th Grade Correlation Summary
| Measurement | Seminole | Immigrants from Grenada |
| Minimum | 89.7% | 80.2% |
| Maximum | 100.0% | 100.0% |
| Range | 10.3% | 19.8% |
| Mean | 94.5% | 93.0% |
| Median | 94.4% | 93.4% |
| Interquartile 25% (IQ1) | 92.7% | 91.6% |
| Interquartile 75% (IQ3) | 95.9% | 95.4% |
| Interquartile Range (IQR) | 3.3% | 3.8% |
| Standard Deviation (Sample) | 2.6% | 4.1% |
| Standard Deviation (Population) | 2.6% | 4.0% |
Similar Demographics by 10th Grade
Demographics Similar to Seminole by 10th Grade
In terms of 10th grade, the demographic groups most similar to Seminole are Immigrants from Liberia (93.3%, a difference of 0.0%), Tongan (93.3%, a difference of 0.020%), Portuguese (93.3%, a difference of 0.040%), Immigrants from Southern Europe (93.2%, a difference of 0.040%), and Ethiopian (93.2%, a difference of 0.060%).
| Demographics | Rating | Rank | 10th Grade |
| Immigrants | Zaire | 16.7 /100 | #212 | Poor 93.4% |
| Immigrants | Asia | 15.7 /100 | #213 | Poor 93.4% |
| Immigrants | Bahamas | 15.2 /100 | #214 | Poor 93.4% |
| Immigrants | Oceania | 15.1 /100 | #215 | Poor 93.4% |
| Immigrants | Eastern Africa | 14.7 /100 | #216 | Poor 93.4% |
| Portuguese | 12.1 /100 | #217 | Poor 93.3% |
| Immigrants | Liberia | 10.2 /100 | #218 | Poor 93.3% |
| Seminole | 10.2 /100 | #219 | Poor 93.3% |
| Tongans | 9.5 /100 | #220 | Tragic 93.3% |
| Immigrants | Southern Europe | 8.9 /100 | #221 | Tragic 93.2% |
| Ethiopians | 7.9 /100 | #222 | Tragic 93.2% |
| Immigrants | Sierra Leone | 7.6 /100 | #223 | Tragic 93.2% |
| Bolivians | 6.7 /100 | #224 | Tragic 93.2% |
| Somalis | 6.2 /100 | #225 | Tragic 93.2% |
| Koreans | 6.1 /100 | #226 | Tragic 93.2% |
Demographics Similar to Immigrants from Grenada by 10th Grade
In terms of 10th grade, the demographic groups most similar to Immigrants from Grenada are Lumbee (91.7%, a difference of 0.13%), Fijian (91.5%, a difference of 0.14%), Haitian (91.8%, a difference of 0.15%), Cuban (91.5%, a difference of 0.17%), and Indonesian (91.8%, a difference of 0.19%).
| Demographics | Rating | Rank | 10th Grade |
| Sri Lankans | 0.0 /100 | #289 | Tragic 91.8% |
| British West Indians | 0.0 /100 | #290 | Tragic 91.8% |
| Immigrants | West Indies | 0.0 /100 | #291 | Tragic 91.8% |
| Immigrants | Burma/Myanmar | 0.0 /100 | #292 | Tragic 91.8% |
| Indonesians | 0.0 /100 | #293 | Tragic 91.8% |
| Haitians | 0.0 /100 | #294 | Tragic 91.8% |
| Lumbee | 0.0 /100 | #295 | Tragic 91.7% |
| Immigrants | Grenada | 0.0 /100 | #296 | Tragic 91.6% |
| Fijians | 0.0 /100 | #297 | Tragic 91.5% |
| Cubans | 0.0 /100 | #298 | Tragic 91.5% |
| Immigrants | Haiti | 0.0 /100 | #299 | Tragic 91.4% |
| Guyanese | 0.0 /100 | #300 | Tragic 91.4% |
| Japanese | 0.0 /100 | #301 | Tragic 91.2% |
| Immigrants | Guyana | 0.0 /100 | #302 | Tragic 91.2% |
| Immigrants | Vietnam | 0.0 /100 | #303 | Tragic 91.2% |