Serbian vs Sioux Doctorate Degree
COMPARE
Serbian
Sioux
Doctorate Degree
Doctorate Degree Comparison
Serbians
Sioux
2.0%
DOCTORATE DEGREE
88.7/ 100
METRIC RATING
135th/ 347
METRIC RANK
1.5%
DOCTORATE DEGREE
0.4/ 100
METRIC RATING
273rd/ 347
METRIC RANK
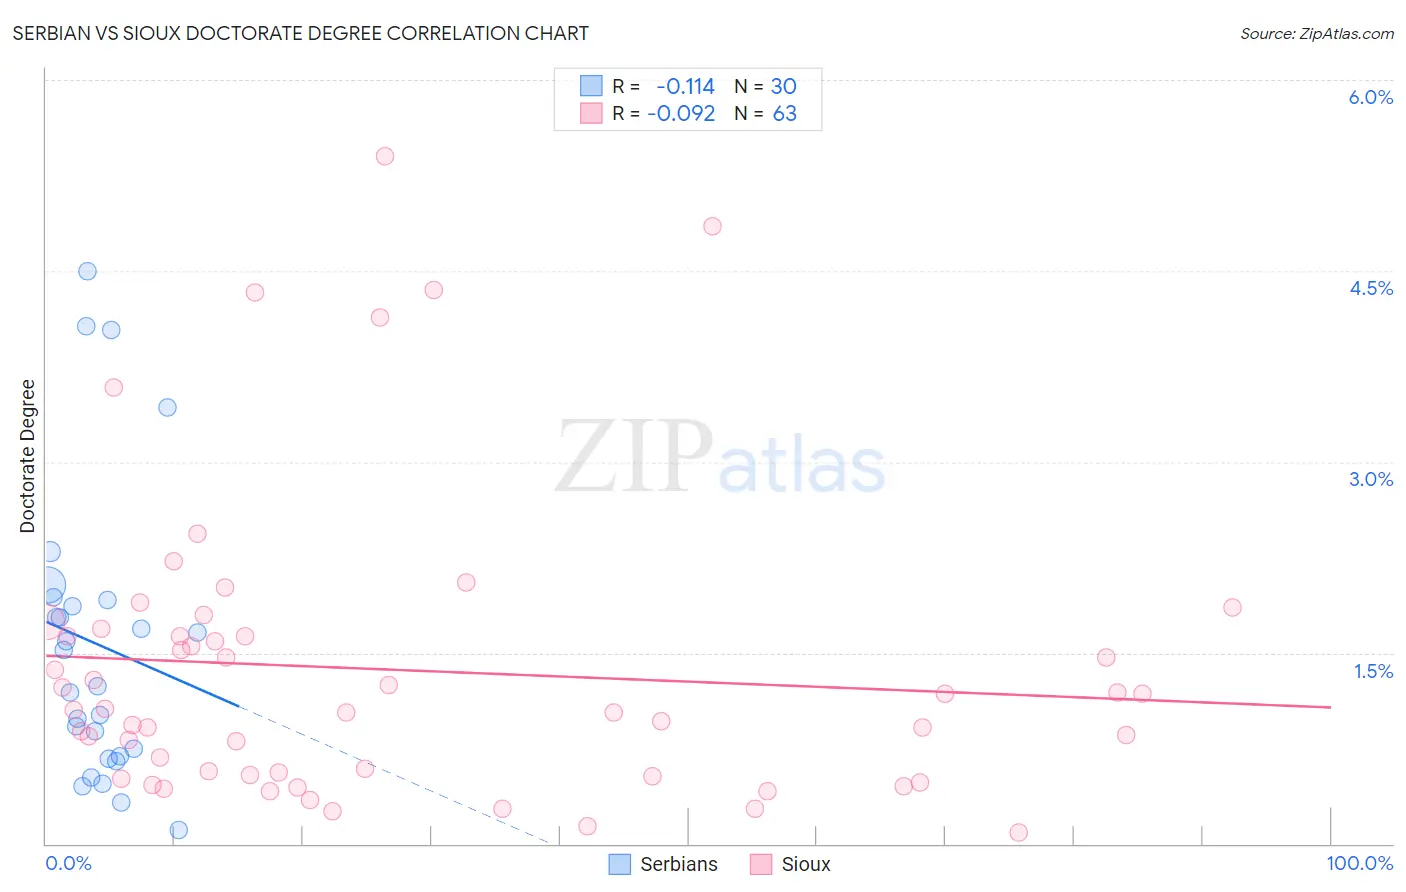
Serbian vs Sioux Doctorate Degree Correlation Chart
The statistical analysis conducted on geographies consisting of 265,941,382 people shows a poor negative correlation between the proportion of Serbians and percentage of population with at least doctorate degree education in the United States with a correlation coefficient (R) of -0.114 and weighted average of 2.0%. Similarly, the statistical analysis conducted on geographies consisting of 231,042,673 people shows a slight negative correlation between the proportion of Sioux and percentage of population with at least doctorate degree education in the United States with a correlation coefficient (R) of -0.092 and weighted average of 1.5%, a difference of 34.3%.
Doctorate Degree Correlation Summary
| Measurement | Serbian | Sioux |
| Minimum | 0.11% | 0.086% |
| Maximum | 4.5% | 5.4% |
| Range | 4.4% | 5.3% |
| Mean | 1.6% | 1.4% |
| Median | 1.4% | 1.1% |
| Interquartile 25% (IQ1) | 0.69% | 0.54% |
| Interquartile 75% (IQ3) | 1.9% | 1.6% |
| Interquartile Range (IQR) | 1.2% | 1.1% |
| Standard Deviation (Sample) | 1.1% | 1.2% |
| Standard Deviation (Population) | 1.1% | 1.2% |
Similar Demographics by Doctorate Degree
Demographics Similar to Serbians by Doctorate Degree
In terms of doctorate degree, the demographic groups most similar to Serbians are Immigrants from Cameroon (2.0%, a difference of 0.060%), Swedish (2.0%, a difference of 0.14%), South American Indian (2.0%, a difference of 0.15%), Immigrants from Uzbekistan (2.0%, a difference of 0.21%), and Swiss (2.0%, a difference of 0.24%).
| Demographics | Rating | Rank | Doctorate Degree |
| Immigrants | Zaire | 91.1 /100 | #128 | Exceptional 2.0% |
| Canadians | 90.6 /100 | #129 | Exceptional 2.0% |
| Immigrants | Ukraine | 90.5 /100 | #130 | Exceptional 2.0% |
| Immigrants | Sierra Leone | 90.2 /100 | #131 | Exceptional 2.0% |
| Scottish | 89.4 /100 | #132 | Excellent 2.0% |
| Immigrants | Uzbekistan | 89.3 /100 | #133 | Excellent 2.0% |
| Immigrants | Cameroon | 88.9 /100 | #134 | Excellent 2.0% |
| Serbians | 88.7 /100 | #135 | Excellent 2.0% |
| Swedes | 88.3 /100 | #136 | Excellent 2.0% |
| South American Indians | 88.3 /100 | #137 | Excellent 2.0% |
| Swiss | 88.0 /100 | #138 | Excellent 2.0% |
| Afghans | 87.2 /100 | #139 | Excellent 2.0% |
| Immigrants | Africa | 87.0 /100 | #140 | Excellent 2.0% |
| Senegalese | 86.7 /100 | #141 | Excellent 2.0% |
| Italians | 86.0 /100 | #142 | Excellent 2.0% |
Demographics Similar to Sioux by Doctorate Degree
In terms of doctorate degree, the demographic groups most similar to Sioux are Yaqui (1.5%, a difference of 0.020%), Immigrants from Barbados (1.5%, a difference of 0.11%), Aleut (1.5%, a difference of 0.14%), Paiute (1.5%, a difference of 0.19%), and Immigrants from Trinidad and Tobago (1.5%, a difference of 0.20%).
| Demographics | Rating | Rank | Doctorate Degree |
| Immigrants | Liberia | 0.5 /100 | #266 | Tragic 1.5% |
| Kiowa | 0.5 /100 | #267 | Tragic 1.5% |
| U.S. Virgin Islanders | 0.5 /100 | #268 | Tragic 1.5% |
| Crow | 0.5 /100 | #269 | Tragic 1.5% |
| Salvadorans | 0.5 /100 | #270 | Tragic 1.5% |
| Immigrants | Trinidad and Tobago | 0.5 /100 | #271 | Tragic 1.5% |
| Immigrants | Barbados | 0.4 /100 | #272 | Tragic 1.5% |
| Sioux | 0.4 /100 | #273 | Tragic 1.5% |
| Yaqui | 0.4 /100 | #274 | Tragic 1.5% |
| Aleuts | 0.4 /100 | #275 | Tragic 1.5% |
| Paiute | 0.4 /100 | #276 | Tragic 1.5% |
| Bahamians | 0.4 /100 | #277 | Tragic 1.5% |
| Hawaiians | 0.4 /100 | #278 | Tragic 1.5% |
| Marshallese | 0.4 /100 | #279 | Tragic 1.5% |
| Ecuadorians | 0.4 /100 | #280 | Tragic 1.5% |