Serbian vs Immigrants from China Doctorate Degree

COMPARE

Serbian
Race
Ancestry
AfghanAfricanAlaska NativeAlaskan AthabascanAlbanianAleutAlsatianAmericanApacheArabArapahoArgentineanArmenianAssyrian/Chaldean/SyriacAustralianAustrianBahamianBangladeshiBarbadianBasqueBelgianBelizeanBermudanBhutaneseBlackfeetBolivianBrazilianBritishBritish West IndianBulgarianBurmeseCajunCambodianCanadianCape VerdeanCarpatho RusynCelticCentral AmericanCentral American IndianCherokeeCheyenneChickasawChileanChineseChippewaChoctawColombianColvilleComancheCosta RicanCreeCreekCroatianCrowCubanCypriotCzechCzechoslovakianDanishDelawareDominicanDutchDutch West IndianEastern EuropeanEcuadorianEgyptianEnglishEstonianEthiopianEuropeanFijianFilipinoFinnishFrenchFrench American IndianFrench CanadianGermanGerman RussianGhanaianGreekGuamanian/ChamorroGuatemalanGuyaneseHaitianHmongHonduranHopiHoumaHungarianIcelanderIndian (Asian)IndonesianInupiatIranianIraqiIrishIroquoisIsraeliItalianJamaicanJapaneseJordanianKenyanKiowaKoreanLaotianLatvianLebaneseLiberianLithuanianLumbeeLuxembourgerMacedonianMalaysianMalteseMarshalleseMenomineeMexicanMexican American IndianMongolianMoroccanNative HawaiianNavajoNepaleseNew ZealanderNicaraguanNigerianNorthern EuropeanNorwegianOkinawanOsageOttawaPaiutePakistaniPalestinianPanamanianParaguayanPennsylvania GermanPeruvianPimaPolishPortuguesePotawatomiPuebloPuerto RicanPuget Sound SalishRomanianRussianSalvadoranSamoanScandinavianScotch-IrishScottishSeminoleSenegaleseSerbianShoshoneSierra LeoneanSiouxSlavicSlovakSloveneSomaliSouth AfricanSouth AmericanSouth American IndianSoviet UnionSpaniardSpanishSpanish AmericanSpanish American IndianSri LankanSubsaharan AfricanSudaneseSwedishSwissSyrianTaiwaneseThaiTlingit-HaidaTohono O'OdhamTonganTrinidadian and TobagonianTsimshianTurkishU.S. Virgin IslanderUgandanUkrainianUruguayanUteVenezuelanVietnameseWelshWest IndianYakamaYaquiYugoslavianYumanYup'ikZimbabwean
Immigration
NonimmigrantsImmigrantsAfghanistanAfricaAlbaniaArgentinaArmeniaAsiaAustraliaAustriaBahamasBangladeshBarbadosBelarusBelgiumBelizeBoliviaBosnia and HerzegovinaBrazilBulgariaBurma/MyanmarCabo VerdeCambodiaCameroonCanadaCaribbeanCentral AmericaChileColombiaCongoCosta RicaCroatiaCubaCzechoslovakiaDenmarkDominicaDominican RepublicEastern AfricaEastern AsiaEastern EuropeEcuadorEgyptEl SalvadorEnglandEritreaEthiopiaEuropeFijiFranceGermanyGhanaGreeceGrenadaGuatemalaGuyanaHaitiHondurasHong KongHungaryIndiaIndonesiaIranIraqIrelandIsraelItalyJamaicaJapanJordanKazakhstanKenyaKoreaKuwaitLaosLatin AmericaLatviaLebanonLiberiaLithuaniaMalaysiaMexicoMicronesiaMiddle AfricaMoldovaMoroccoNepalNetherlandsNicaraguaNigeriaNorth AmericaNorth MacedoniaNorthern AfricaNorthern EuropeNorwayOceaniaPakistanPanamaPeruPhilippinesPolandPortugalRomaniaRussiaSaudi ArabiaScotlandSenegalSerbiaSierra LeoneSingaporeSomaliaSouth AfricaSouth AmericaSouth Central AsiaSouth Eastern AsiaSouthern EuropeSpainSri LankaSt. Vincent and the GrenadinesSudanSwedenSwitzerlandSyriaTaiwanThailandTrinidad and TobagoTurkeyUgandaUkraineUruguayUzbekistanVenezuelaVietnamWest IndiesWestern AfricaWestern AsiaWestern EuropeYemenZaireZimbabweAzores
Immigrants from China
Race
Ancestry
AfghanAfricanAlaska NativeAlaskan AthabascanAlbanianAleutAlsatianAmericanApacheArabArapahoArgentineanArmenianAssyrian/Chaldean/SyriacAustralianAustrianBahamianBangladeshiBarbadianBasqueBelgianBelizeanBermudanBhutaneseBlackfeetBolivianBrazilianBritishBritish West IndianBulgarianBurmeseCajunCambodianCanadianCape VerdeanCarpatho RusynCelticCentral AmericanCentral American IndianCherokeeCheyenneChickasawChileanChineseChippewaChoctawColombianColvilleComancheCosta RicanCreeCreekCroatianCrowCubanCypriotCzechCzechoslovakianDanishDelawareDominicanDutchDutch West IndianEastern EuropeanEcuadorianEgyptianEnglishEstonianEthiopianEuropeanFijianFilipinoFinnishFrenchFrench American IndianFrench CanadianGermanGerman RussianGhanaianGreekGuamanian/ChamorroGuatemalanGuyaneseHaitianHmongHonduranHopiHoumaHungarianIcelanderIndian (Asian)IndonesianInupiatIranianIraqiIrishIroquoisIsraeliItalianJamaicanJapaneseJordanianKenyanKiowaKoreanLaotianLatvianLebaneseLiberianLithuanianLumbeeLuxembourgerMacedonianMalaysianMalteseMarshalleseMenomineeMexicanMexican American IndianMongolianMoroccanNative HawaiianNavajoNepaleseNew ZealanderNicaraguanNigerianNorthern EuropeanNorwegianOkinawanOsageOttawaPaiutePakistaniPalestinianPanamanianParaguayanPennsylvania GermanPeruvianPimaPolishPortuguesePotawatomiPuebloPuerto RicanPuget Sound SalishRomanianRussianSalvadoranSamoanScandinavianScotch-IrishScottishSeminoleSenegaleseShoshoneSierra LeoneanSiouxSlavicSlovakSloveneSomaliSouth AfricanSouth AmericanSouth American IndianSoviet UnionSpaniardSpanishSpanish AmericanSpanish American IndianSri LankanSubsaharan AfricanSudaneseSwedishSwissSyrianTaiwaneseThaiTlingit-HaidaTohono O'OdhamTonganTrinidadian and TobagonianTsimshianTurkishU.S. Virgin IslanderUgandanUkrainianUruguayanUteVenezuelanVietnameseWelshWest IndianYakamaYaquiYugoslavianYumanYup'ikZimbabwean
Immigration
NonimmigrantsImmigrantsAfghanistanAfricaAlbaniaArgentinaArmeniaAsiaAustraliaAustriaBahamasBangladeshBarbadosBelarusBelgiumBelizeBoliviaBosnia and HerzegovinaBrazilBulgariaBurma/MyanmarCabo VerdeCambodiaCameroonCanadaCaribbeanCentral AmericaChileChinaColombiaCongoCosta RicaCroatiaCubaCzechoslovakiaDenmarkDominicaDominican RepublicEastern AfricaEastern AsiaEastern EuropeEcuadorEgyptEl SalvadorEnglandEritreaEthiopiaEuropeFijiFranceGermanyGhanaGreeceGrenadaGuatemalaGuyanaHaitiHondurasHong KongHungaryIndiaIndonesiaIranIraqIrelandIsraelItalyJamaicaJapanJordanKazakhstanKenyaKoreaKuwaitLaosLatin AmericaLatviaLebanonLiberiaLithuaniaMalaysiaMexicoMicronesiaMiddle AfricaMoldovaMoroccoNepalNetherlandsNicaraguaNigeriaNorth AmericaNorth MacedoniaNorthern AfricaNorthern EuropeNorwayOceaniaPakistanPanamaPeruPhilippinesPolandPortugalRomaniaRussiaSaudi ArabiaScotlandSenegalSerbiaSierra LeoneSingaporeSomaliaSouth AfricaSouth AmericaSouth Central AsiaSouth Eastern AsiaSouthern EuropeSpainSri LankaSt. Vincent and the GrenadinesSudanSwedenSwitzerlandSyriaTaiwanThailandTrinidad and TobagoTurkeyUgandaUkraineUruguayUzbekistanVenezuelaVietnamWest IndiesWestern AfricaWestern AsiaWestern EuropeYemenZaireZimbabweAzores
Doctorate Degree
Income
Poverty
Unemployment
Labor Participation
Family Structure
Vehicle Availability
Education Level
Disability

Doctorate Degree Comparison

Serbians

Immigrants from China

Excellent
Exceptional
2.0%
DOCTORATE DEGREE
88.7/ 100
METRIC RATING
135th/ 347
METRIC RANK
3.1%
DOCTORATE DEGREE
100.0/ 100
METRIC RATING
7th/ 347
METRIC RANK

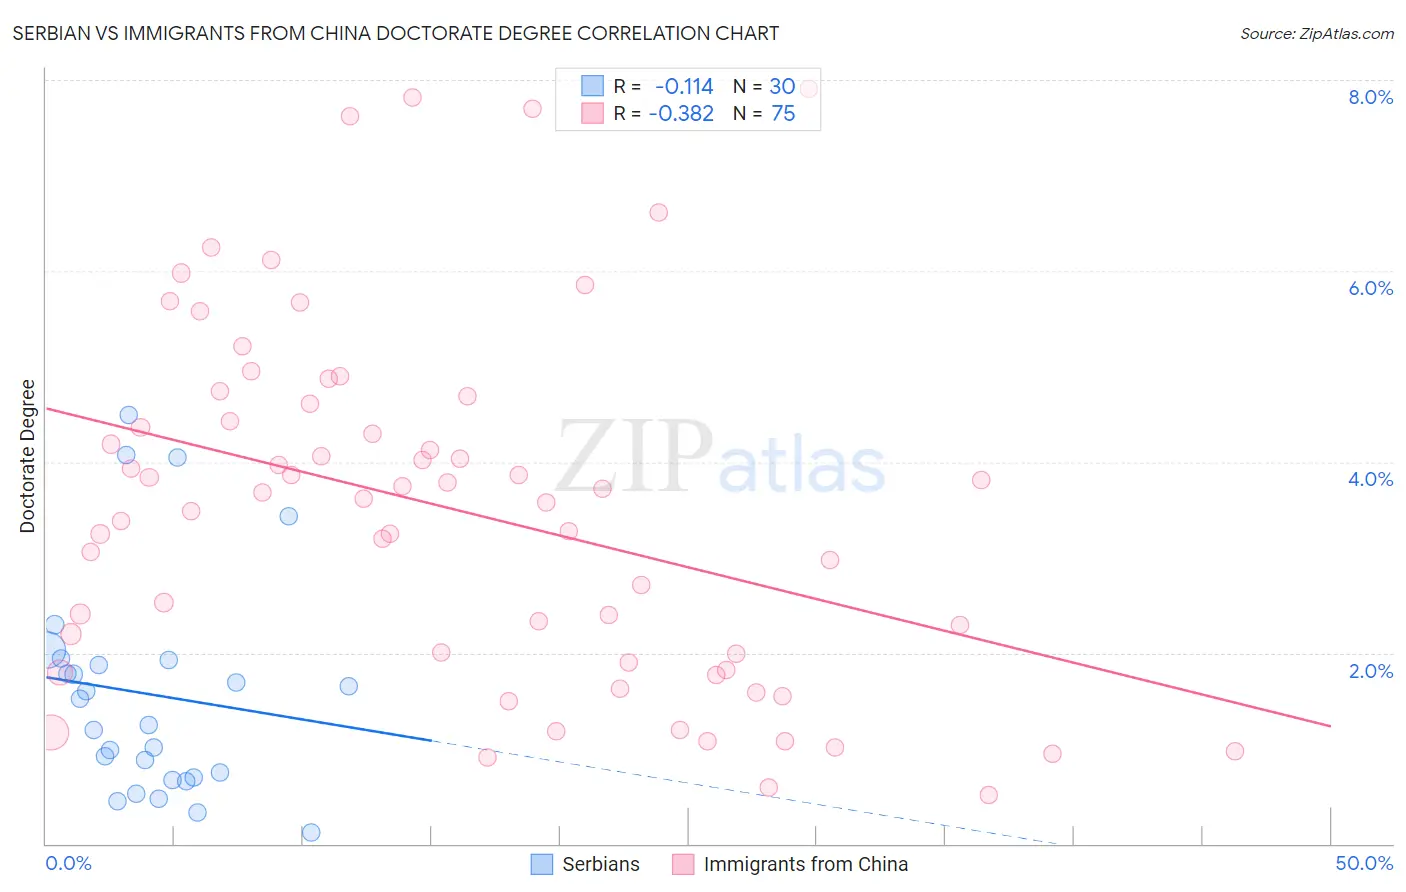
Serbian vs Immigrants from China Doctorate Degree Correlation Chart

The statistical analysis conducted on geographies consisting of 265,941,382 people shows a poor negative correlation between the proportion of Serbians and percentage of population with at least doctorate degree education in the United States with a correlation coefficient (R) of -0.114 and weighted average of 2.0%. Similarly, the statistical analysis conducted on geographies consisting of 452,322,361 people shows a mild negative correlation between the proportion of Immigrants from China and percentage of population with at least doctorate degree education in the United States with a correlation coefficient (R) of -0.382 and weighted average of 3.1%, a difference of 56.1%.
Serbian vs Immigrants from China Doctorate Degree

Doctorate Degree Correlation Summary

MeasurementSerbianImmigrants from China
Minimum0.11%0.51%
Maximum4.5%7.9%
Range4.4%7.4%
Mean1.6%3.5%
Median1.4%3.6%
Interquartile 25% (IQ1)0.69%1.9%
Interquartile 75% (IQ3)1.9%4.6%
Interquartile Range (IQR)1.2%2.7%
Standard Deviation (Sample)1.1%1.8%
Standard Deviation (Population)1.1%1.8%

Similar Demographics by Doctorate Degree

Demographics Similar to Serbians by Doctorate Degree

In terms of doctorate degree, the demographic groups most similar to Serbians are Immigrants from Cameroon (2.0%, a difference of 0.060%), Swedish (2.0%, a difference of 0.14%), South American Indian (2.0%, a difference of 0.15%), Immigrants from Uzbekistan (2.0%, a difference of 0.21%), and Swiss (2.0%, a difference of 0.24%).
DemographicsRating | RankDoctorate Degree
Immigrants | Zaire
91.1
/100
|
#128
Exceptional
2.0%
Canadians
90.6
/100
|
#129
Exceptional
2.0%
Immigrants | Ukraine
90.5
/100
|
#130
Exceptional
2.0%
Immigrants | Sierra Leone
90.2
/100
|
#131
Exceptional
2.0%
Scottish
89.4
/100
|
#132
Excellent
2.0%
Immigrants | Uzbekistan
89.3
/100
|
#133
Excellent
2.0%
Immigrants | Cameroon
88.9
/100
|
#134
Excellent
2.0%
Serbians
88.7
/100
|
#135
Excellent
2.0%
Swedes
88.3
/100
|
#136
Excellent
2.0%
South American Indians
88.3
/100
|
#137
Excellent
2.0%
Swiss
88.0
/100
|
#138
Excellent
2.0%
Afghans
87.2
/100
|
#139
Excellent
2.0%
Immigrants | Africa
87.0
/100
|
#140
Excellent
2.0%
Senegalese
86.7
/100
|
#141
Excellent
2.0%
Italians
86.0
/100
|
#142
Excellent
2.0%

Demographics Similar to Immigrants from China by Doctorate Degree

In terms of doctorate degree, the demographic groups most similar to Immigrants from China are Immigrants from Switzerland (3.1%, a difference of 0.070%), Immigrants from Israel (3.0%, a difference of 1.3%), Iranian (3.1%, a difference of 2.0%), Immigrants from Iran (3.0%, a difference of 2.0%), and Immigrants from Taiwan (3.2%, a difference of 3.6%).
DemographicsRating | RankDoctorate Degree
Immigrants | Singapore
100.0
/100
|
#1
Exceptional
3.7%
Filipinos
100.0
/100
|
#2
Exceptional
3.4%
Okinawans
100.0
/100
|
#3
Exceptional
3.3%
Immigrants | Taiwan
100.0
/100
|
#4
Exceptional
3.2%
Iranians
100.0
/100
|
#5
Exceptional
3.1%
Immigrants | Switzerland
100.0
/100
|
#6
Exceptional
3.1%
Immigrants | China
100.0
/100
|
#7
Exceptional
3.1%
Immigrants | Israel
100.0
/100
|
#8
Exceptional
3.0%
Immigrants | Iran
100.0
/100
|
#9
Exceptional
3.0%
Immigrants | Eastern Asia
100.0
/100
|
#10
Exceptional
3.0%
Indians (Asian)
100.0
/100
|
#11
Exceptional
2.9%
Immigrants | Belgium
100.0
/100
|
#12
Exceptional
2.9%
Immigrants | Sweden
100.0
/100
|
#13
Exceptional
2.9%
Immigrants | France
100.0
/100
|
#14
Exceptional
2.9%
Immigrants | India
100.0
/100
|
#15
Exceptional
2.8%