Serbian vs Arab 10th Grade
COMPARE
Serbian
Arab
10th Grade
10th Grade Comparison
Serbians
Arabs
95.1%
10TH GRADE
99.9/ 100
METRIC RATING
47th/ 347
METRIC RANK
94.0%
10TH GRADE
80.9/ 100
METRIC RATING
148th/ 347
METRIC RANK
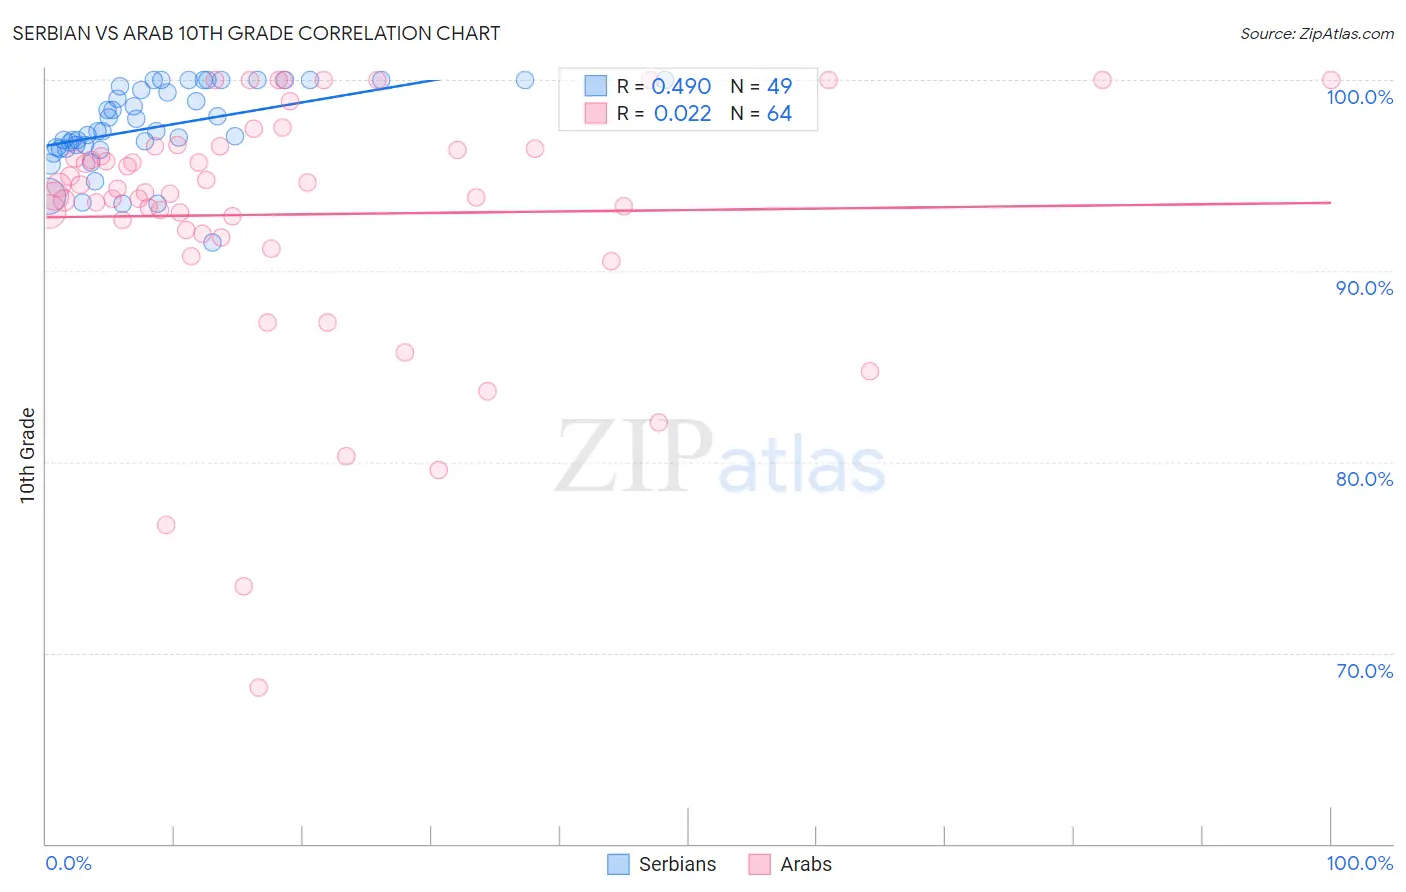
Serbian vs Arab 10th Grade Correlation Chart
The statistical analysis conducted on geographies consisting of 267,640,774 people shows a moderate positive correlation between the proportion of Serbians and percentage of population with at least 10th grade education in the United States with a correlation coefficient (R) of 0.490 and weighted average of 95.1%. Similarly, the statistical analysis conducted on geographies consisting of 486,870,847 people shows no correlation between the proportion of Arabs and percentage of population with at least 10th grade education in the United States with a correlation coefficient (R) of 0.022 and weighted average of 94.0%, a difference of 1.2%.
10th Grade Correlation Summary
| Measurement | Serbian | Arab |
| Minimum | 91.5% | 68.2% |
| Maximum | 100.0% | 100.0% |
| Range | 8.5% | 31.8% |
| Mean | 97.6% | 93.0% |
| Median | 97.3% | 94.2% |
| Interquartile 25% (IQ1) | 96.4% | 92.0% |
| Interquartile 75% (IQ3) | 99.8% | 96.5% |
| Interquartile Range (IQR) | 3.4% | 4.4% |
| Standard Deviation (Sample) | 2.1% | 6.6% |
| Standard Deviation (Population) | 2.1% | 6.5% |
Similar Demographics by 10th Grade
Demographics Similar to Serbians by 10th Grade
In terms of 10th grade, the demographic groups most similar to Serbians are Czechoslovakian (95.1%, a difference of 0.010%), Immigrants from Northern Europe (95.2%, a difference of 0.020%), Greek (95.2%, a difference of 0.020%), Australian (95.1%, a difference of 0.020%), and Macedonian (95.2%, a difference of 0.030%).
| Demographics | Rating | Rank | 10th Grade |
| Scotch-Irish | 99.9 /100 | #40 | Exceptional 95.2% |
| Russians | 99.9 /100 | #41 | Exceptional 95.2% |
| Slavs | 99.9 /100 | #42 | Exceptional 95.2% |
| Macedonians | 99.9 /100 | #43 | Exceptional 95.2% |
| Immigrants | Northern Europe | 99.9 /100 | #44 | Exceptional 95.2% |
| Greeks | 99.9 /100 | #45 | Exceptional 95.2% |
| Czechoslovakians | 99.9 /100 | #46 | Exceptional 95.1% |
| Serbians | 99.9 /100 | #47 | Exceptional 95.1% |
| Australians | 99.9 /100 | #48 | Exceptional 95.1% |
| Immigrants | Austria | 99.9 /100 | #49 | Exceptional 95.1% |
| Immigrants | Canada | 99.8 /100 | #50 | Exceptional 95.1% |
| Austrians | 99.8 /100 | #51 | Exceptional 95.1% |
| Ottawa | 99.8 /100 | #52 | Exceptional 95.1% |
| Immigrants | North America | 99.8 /100 | #53 | Exceptional 95.0% |
| Immigrants | Lithuania | 99.8 /100 | #54 | Exceptional 95.0% |
Demographics Similar to Arabs by 10th Grade
In terms of 10th grade, the demographic groups most similar to Arabs are Ugandan (94.0%, a difference of 0.0%), Immigrants from Ukraine (94.0%, a difference of 0.010%), Chickasaw (94.1%, a difference of 0.020%), Egyptian (94.0%, a difference of 0.020%), and Kenyan (94.0%, a difference of 0.030%).
| Demographics | Rating | Rank | 10th Grade |
| Hmong | 86.6 /100 | #141 | Excellent 94.1% |
| Albanians | 86.5 /100 | #142 | Excellent 94.1% |
| Cherokee | 84.9 /100 | #143 | Excellent 94.1% |
| Immigrants | Kazakhstan | 84.9 /100 | #144 | Excellent 94.1% |
| Immigrants | Nonimmigrants | 83.8 /100 | #145 | Excellent 94.1% |
| Chickasaw | 82.6 /100 | #146 | Excellent 94.1% |
| Immigrants | Ukraine | 81.5 /100 | #147 | Excellent 94.0% |
| Arabs | 80.9 /100 | #148 | Excellent 94.0% |
| Ugandans | 80.7 /100 | #149 | Excellent 94.0% |
| Egyptians | 79.6 /100 | #150 | Good 94.0% |
| Kenyans | 79.1 /100 | #151 | Good 94.0% |
| Immigrants | Italy | 78.0 /100 | #152 | Good 94.0% |
| Immigrants | Brazil | 75.5 /100 | #153 | Good 94.0% |
| Immigrants | Kenya | 75.3 /100 | #154 | Good 94.0% |
| Spanish | 74.9 /100 | #155 | Good 94.0% |