Serbian vs Alaska Native 10th Grade
COMPARE
Serbian
Alaska Native
10th Grade
10th Grade Comparison
Serbians
Alaska Natives
95.1%
10TH GRADE
99.9/ 100
METRIC RATING
47th/ 347
METRIC RANK
94.9%
10TH GRADE
99.6/ 100
METRIC RATING
71st/ 347
METRIC RANK
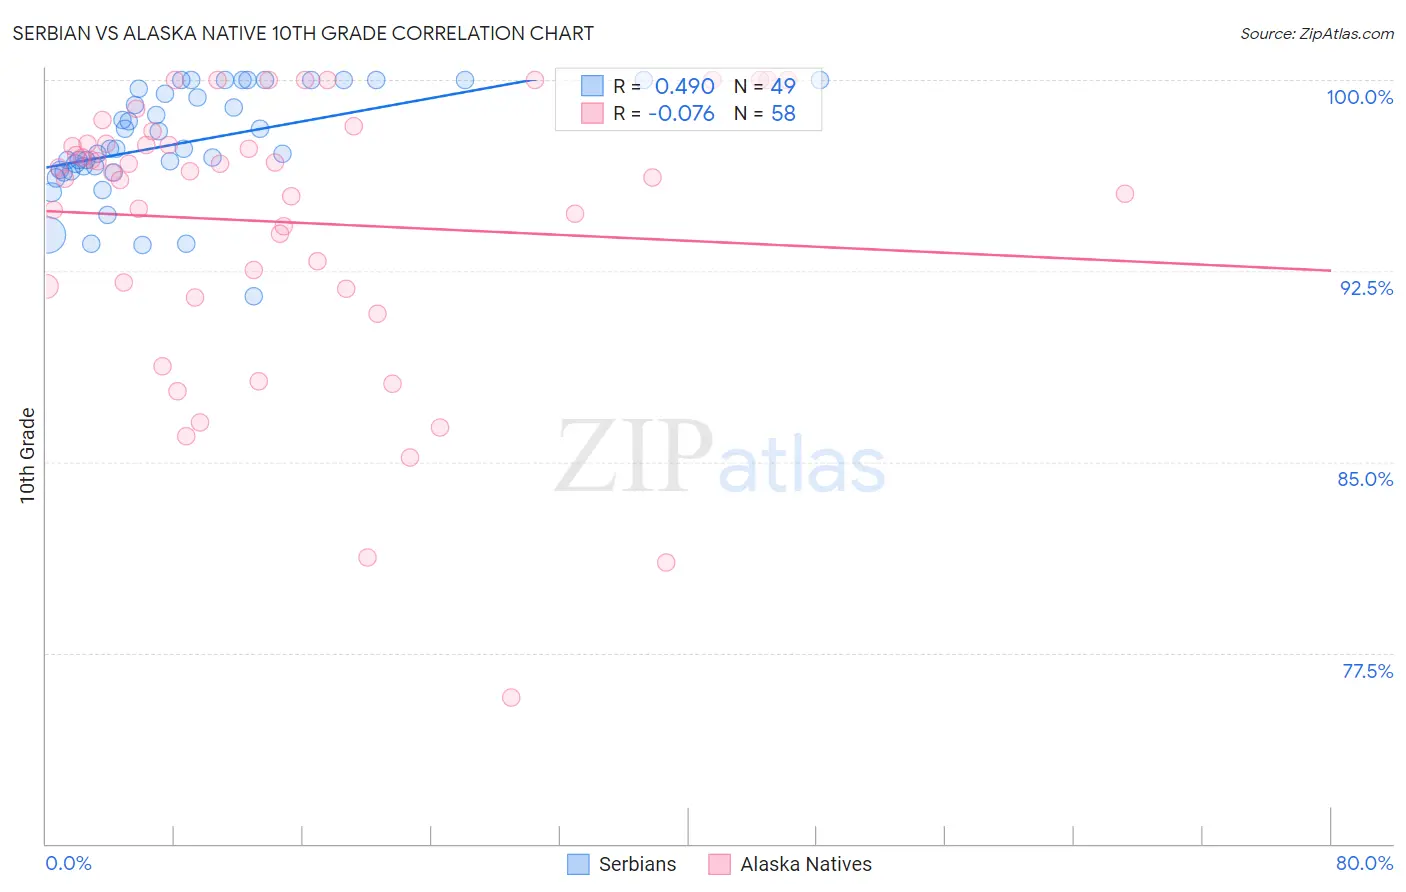
Serbian vs Alaska Native 10th Grade Correlation Chart
The statistical analysis conducted on geographies consisting of 267,640,774 people shows a moderate positive correlation between the proportion of Serbians and percentage of population with at least 10th grade education in the United States with a correlation coefficient (R) of 0.490 and weighted average of 95.1%. Similarly, the statistical analysis conducted on geographies consisting of 76,778,743 people shows a slight negative correlation between the proportion of Alaska Natives and percentage of population with at least 10th grade education in the United States with a correlation coefficient (R) of -0.076 and weighted average of 94.9%, a difference of 0.26%.
10th Grade Correlation Summary
| Measurement | Serbian | Alaska Native |
| Minimum | 91.5% | 75.7% |
| Maximum | 100.0% | 100.0% |
| Range | 8.5% | 24.3% |
| Mean | 97.6% | 94.4% |
| Median | 97.3% | 96.4% |
| Interquartile 25% (IQ1) | 96.4% | 91.9% |
| Interquartile 75% (IQ3) | 99.8% | 97.5% |
| Interquartile Range (IQR) | 3.4% | 5.6% |
| Standard Deviation (Sample) | 2.1% | 5.4% |
| Standard Deviation (Population) | 2.1% | 5.4% |
Similar Demographics by 10th Grade
Demographics Similar to Serbians by 10th Grade
In terms of 10th grade, the demographic groups most similar to Serbians are Czechoslovakian (95.1%, a difference of 0.010%), Immigrants from Northern Europe (95.2%, a difference of 0.020%), Greek (95.2%, a difference of 0.020%), Australian (95.1%, a difference of 0.020%), and Macedonian (95.2%, a difference of 0.030%).
| Demographics | Rating | Rank | 10th Grade |
| Scotch-Irish | 99.9 /100 | #40 | Exceptional 95.2% |
| Russians | 99.9 /100 | #41 | Exceptional 95.2% |
| Slavs | 99.9 /100 | #42 | Exceptional 95.2% |
| Macedonians | 99.9 /100 | #43 | Exceptional 95.2% |
| Immigrants | Northern Europe | 99.9 /100 | #44 | Exceptional 95.2% |
| Greeks | 99.9 /100 | #45 | Exceptional 95.2% |
| Czechoslovakians | 99.9 /100 | #46 | Exceptional 95.1% |
| Serbians | 99.9 /100 | #47 | Exceptional 95.1% |
| Australians | 99.9 /100 | #48 | Exceptional 95.1% |
| Immigrants | Austria | 99.9 /100 | #49 | Exceptional 95.1% |
| Immigrants | Canada | 99.8 /100 | #50 | Exceptional 95.1% |
| Austrians | 99.8 /100 | #51 | Exceptional 95.1% |
| Ottawa | 99.8 /100 | #52 | Exceptional 95.1% |
| Immigrants | North America | 99.8 /100 | #53 | Exceptional 95.0% |
| Immigrants | Lithuania | 99.8 /100 | #54 | Exceptional 95.0% |
Demographics Similar to Alaska Natives by 10th Grade
In terms of 10th grade, the demographic groups most similar to Alaska Natives are Zimbabwean (94.9%, a difference of 0.0%), Immigrants from England (94.9%, a difference of 0.010%), Immigrants from Sweden (94.9%, a difference of 0.020%), Bhutanese (94.9%, a difference of 0.020%), and Canadian (94.9%, a difference of 0.020%).
| Demographics | Rating | Rank | 10th Grade |
| Native Hawaiians | 99.7 /100 | #64 | Exceptional 95.0% |
| Turks | 99.7 /100 | #65 | Exceptional 95.0% |
| Immigrants | Australia | 99.7 /100 | #66 | Exceptional 94.9% |
| Immigrants | Netherlands | 99.7 /100 | #67 | Exceptional 94.9% |
| Immigrants | Belgium | 99.7 /100 | #68 | Exceptional 94.9% |
| Immigrants | England | 99.6 /100 | #69 | Exceptional 94.9% |
| Zimbabweans | 99.6 /100 | #70 | Exceptional 94.9% |
| Alaska Natives | 99.6 /100 | #71 | Exceptional 94.9% |
| Immigrants | Sweden | 99.6 /100 | #72 | Exceptional 94.9% |
| Bhutanese | 99.6 /100 | #73 | Exceptional 94.9% |
| Canadians | 99.6 /100 | #74 | Exceptional 94.9% |
| Okinawans | 99.5 /100 | #75 | Exceptional 94.8% |
| Romanians | 99.5 /100 | #76 | Exceptional 94.8% |
| Immigrants | South Africa | 99.5 /100 | #77 | Exceptional 94.8% |
| Filipinos | 99.3 /100 | #78 | Exceptional 94.8% |