Immigrants from Western Asia vs Immigrants from Peru Professional Degree
COMPARE
Immigrants from Western Asia
Immigrants from Peru
Professional Degree
Professional Degree Comparison
Immigrants from Western Asia
Immigrants from Peru
5.4%
PROFESSIONAL DEGREE
99.8/ 100
METRIC RATING
71st/ 347
METRIC RANK
4.4%
PROFESSIONAL DEGREE
49.3/ 100
METRIC RATING
176th/ 347
METRIC RANK
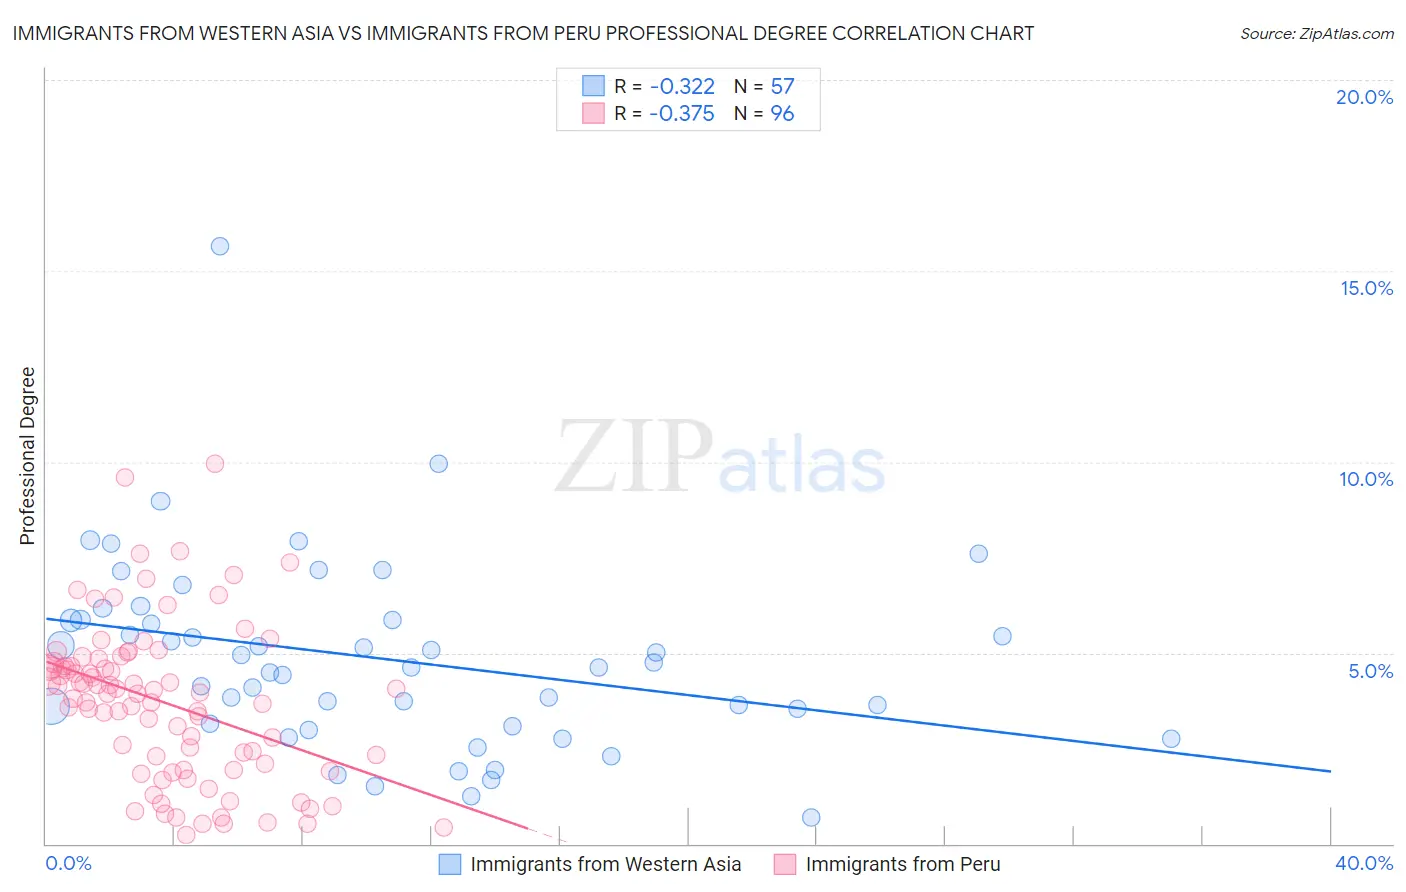
Immigrants from Western Asia vs Immigrants from Peru Professional Degree Correlation Chart
The statistical analysis conducted on geographies consisting of 403,868,924 people shows a mild negative correlation between the proportion of Immigrants from Western Asia and percentage of population with at least professional degree education in the United States with a correlation coefficient (R) of -0.322 and weighted average of 5.4%. Similarly, the statistical analysis conducted on geographies consisting of 328,575,904 people shows a mild negative correlation between the proportion of Immigrants from Peru and percentage of population with at least professional degree education in the United States with a correlation coefficient (R) of -0.375 and weighted average of 4.4%, a difference of 22.8%.
Professional Degree Correlation Summary
| Measurement | Immigrants from Western Asia | Immigrants from Peru |
| Minimum | 0.70% | 0.24% |
| Maximum | 15.7% | 9.9% |
| Range | 14.9% | 9.7% |
| Mean | 4.8% | 3.7% |
| Median | 4.6% | 3.9% |
| Interquartile 25% (IQ1) | 3.1% | 2.0% |
| Interquartile 75% (IQ3) | 5.9% | 4.7% |
| Interquartile Range (IQR) | 2.8% | 2.7% |
| Standard Deviation (Sample) | 2.5% | 2.0% |
| Standard Deviation (Population) | 2.5% | 2.0% |
Similar Demographics by Professional Degree
Demographics Similar to Immigrants from Western Asia by Professional Degree
In terms of professional degree, the demographic groups most similar to Immigrants from Western Asia are Lithuanian (5.4%, a difference of 0.48%), Immigrants from Romania (5.4%, a difference of 0.58%), Bhutanese (5.4%, a difference of 0.59%), Immigrants from Hungary (5.5%, a difference of 0.92%), and Ethiopian (5.4%, a difference of 0.96%).
| Demographics | Rating | Rank | Professional Degree |
| Immigrants | Asia | 99.9 /100 | #64 | Exceptional 5.5% |
| Immigrants | Bolivia | 99.9 /100 | #65 | Exceptional 5.5% |
| Immigrants | Kazakhstan | 99.9 /100 | #66 | Exceptional 5.5% |
| Immigrants | Bulgaria | 99.9 /100 | #67 | Exceptional 5.5% |
| Immigrants | Lebanon | 99.9 /100 | #68 | Exceptional 5.5% |
| Immigrants | Hungary | 99.9 /100 | #69 | Exceptional 5.5% |
| Bhutanese | 99.8 /100 | #70 | Exceptional 5.4% |
| Immigrants | Western Asia | 99.8 /100 | #71 | Exceptional 5.4% |
| Lithuanians | 99.8 /100 | #72 | Exceptional 5.4% |
| Immigrants | Romania | 99.8 /100 | #73 | Exceptional 5.4% |
| Ethiopians | 99.7 /100 | #74 | Exceptional 5.4% |
| Immigrants | Indonesia | 99.7 /100 | #75 | Exceptional 5.3% |
| Immigrants | Canada | 99.7 /100 | #76 | Exceptional 5.3% |
| Immigrants | Ethiopia | 99.7 /100 | #77 | Exceptional 5.3% |
| Armenians | 99.7 /100 | #78 | Exceptional 5.3% |
Demographics Similar to Immigrants from Peru by Professional Degree
In terms of professional degree, the demographic groups most similar to Immigrants from Peru are Kenyan (4.4%, a difference of 0.10%), Irish (4.4%, a difference of 0.10%), English (4.4%, a difference of 0.11%), Celtic (4.4%, a difference of 0.25%), and Spaniard (4.4%, a difference of 0.39%).
| Demographics | Rating | Rank | Professional Degree |
| Chinese | 58.6 /100 | #169 | Average 4.5% |
| Immigrants | Zaire | 57.4 /100 | #170 | Average 4.5% |
| Immigrants | Bangladesh | 56.0 /100 | #171 | Average 4.4% |
| Spaniards | 52.0 /100 | #172 | Average 4.4% |
| English | 50.1 /100 | #173 | Average 4.4% |
| Kenyans | 50.0 /100 | #174 | Average 4.4% |
| Irish | 50.0 /100 | #175 | Average 4.4% |
| Immigrants | Peru | 49.3 /100 | #176 | Average 4.4% |
| Celtics | 47.6 /100 | #177 | Average 4.4% |
| Immigrants | Costa Rica | 46.7 /100 | #178 | Average 4.4% |
| Immigrants | Kenya | 45.9 /100 | #179 | Average 4.4% |
| Czechs | 44.9 /100 | #180 | Average 4.4% |
| Danes | 43.5 /100 | #181 | Average 4.4% |
| Immigrants | Immigrants | 43.2 /100 | #182 | Average 4.4% |
| Bermudans | 43.1 /100 | #183 | Average 4.4% |