Senegalese vs Immigrants from Cuba 3rd Grade
COMPARE
Senegalese
Immigrants from Cuba
3rd Grade
3rd Grade Comparison
Senegalese
Immigrants from Cuba
97.5%
3RD GRADE
3.0/ 100
METRIC RATING
229th/ 347
METRIC RANK
96.8%
3RD GRADE
0.0/ 100
METRIC RATING
301st/ 347
METRIC RANK
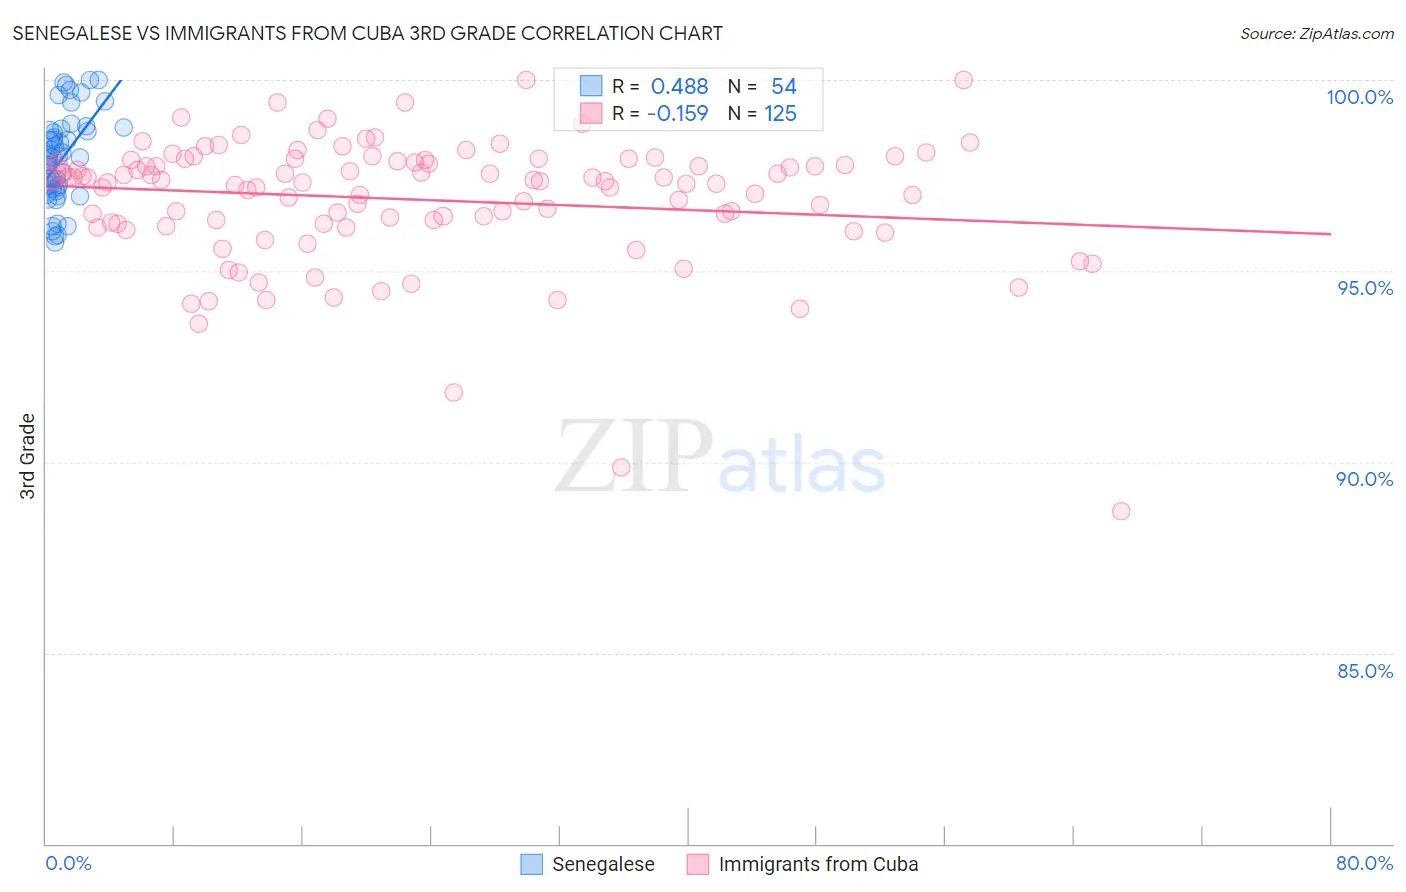
Senegalese vs Immigrants from Cuba 3rd Grade Correlation Chart
The statistical analysis conducted on geographies consisting of 78,142,569 people shows a moderate positive correlation between the proportion of Senegalese and percentage of population with at least 3rd grade education in the United States with a correlation coefficient (R) of 0.488 and weighted average of 97.5%. Similarly, the statistical analysis conducted on geographies consisting of 326,028,159 people shows a poor negative correlation between the proportion of Immigrants from Cuba and percentage of population with at least 3rd grade education in the United States with a correlation coefficient (R) of -0.159 and weighted average of 96.8%, a difference of 0.67%.
3rd Grade Correlation Summary
| Measurement | Senegalese | Immigrants from Cuba |
| Minimum | 95.7% | 88.7% |
| Maximum | 100.0% | 100.0% |
| Range | 4.3% | 11.3% |
| Mean | 97.9% | 96.9% |
| Median | 98.0% | 97.3% |
| Interquartile 25% (IQ1) | 97.1% | 96.2% |
| Interquartile 75% (IQ3) | 98.7% | 97.9% |
| Interquartile Range (IQR) | 1.6% | 1.6% |
| Standard Deviation (Sample) | 1.2% | 1.7% |
| Standard Deviation (Population) | 1.1% | 1.7% |
Similar Demographics by 3rd Grade
Demographics Similar to Senegalese by 3rd Grade
In terms of 3rd grade, the demographic groups most similar to Senegalese are Immigrants from Sudan (97.5%, a difference of 0.010%), Subsaharan African (97.5%, a difference of 0.010%), Immigrants from Pakistan (97.5%, a difference of 0.010%), Immigrants from Costa Rica (97.5%, a difference of 0.010%), and Immigrants from Western Asia (97.5%, a difference of 0.010%).
| Demographics | Rating | Rank | 3rd Grade |
| Sierra Leoneans | 4.6 /100 | #222 | Tragic 97.5% |
| Immigrants | Syria | 4.4 /100 | #223 | Tragic 97.5% |
| Bahamians | 4.4 /100 | #224 | Tragic 97.5% |
| Tongans | 4.3 /100 | #225 | Tragic 97.5% |
| Sudanese | 4.1 /100 | #226 | Tragic 97.5% |
| Immigrants | Sudan | 3.4 /100 | #227 | Tragic 97.5% |
| Sub-Saharan Africans | 3.2 /100 | #228 | Tragic 97.5% |
| Senegalese | 3.0 /100 | #229 | Tragic 97.5% |
| Immigrants | Pakistan | 2.7 /100 | #230 | Tragic 97.5% |
| Immigrants | Costa Rica | 2.7 /100 | #231 | Tragic 97.5% |
| Immigrants | Western Asia | 2.6 /100 | #232 | Tragic 97.5% |
| Immigrants | Malaysia | 2.4 /100 | #233 | Tragic 97.5% |
| Immigrants | Eastern Asia | 1.9 /100 | #234 | Tragic 97.4% |
| Immigrants | Iraq | 1.8 /100 | #235 | Tragic 97.4% |
| Liberians | 1.8 /100 | #236 | Tragic 97.4% |
Demographics Similar to Immigrants from Cuba by 3rd Grade
In terms of 3rd grade, the demographic groups most similar to Immigrants from Cuba are Immigrants from South Eastern Asia (96.8%, a difference of 0.010%), Somali (96.8%, a difference of 0.020%), Haitian (96.9%, a difference of 0.030%), Immigrants from Dominica (96.9%, a difference of 0.030%), and Immigrants (96.9%, a difference of 0.050%).
| Demographics | Rating | Rank | 3rd Grade |
| Malaysians | 0.0 /100 | #294 | Tragic 97.0% |
| Immigrants | Eritrea | 0.0 /100 | #295 | Tragic 97.0% |
| Immigrants | Immigrants | 0.0 /100 | #296 | Tragic 96.9% |
| Haitians | 0.0 /100 | #297 | Tragic 96.9% |
| Immigrants | Dominica | 0.0 /100 | #298 | Tragic 96.9% |
| Somalis | 0.0 /100 | #299 | Tragic 96.8% |
| Immigrants | South Eastern Asia | 0.0 /100 | #300 | Tragic 96.8% |
| Immigrants | Cuba | 0.0 /100 | #301 | Tragic 96.8% |
| Immigrants | Somalia | 0.0 /100 | #302 | Tragic 96.8% |
| Ecuadorians | 0.0 /100 | #303 | Tragic 96.7% |
| Immigrants | Caribbean | 0.0 /100 | #304 | Tragic 96.7% |
| Central American Indians | 0.0 /100 | #305 | Tragic 96.7% |
| Guyanese | 0.0 /100 | #306 | Tragic 96.7% |
| Nicaraguans | 0.0 /100 | #307 | Tragic 96.7% |
| Immigrants | Haiti | 0.0 /100 | #308 | Tragic 96.7% |