Senegalese vs Ute GED/Equivalency
COMPARE
Senegalese
Ute
GED/Equivalency
GED/Equivalency Comparison
Senegalese
Ute
84.0%
GED/EQUIVALENCY
1.9/ 100
METRIC RATING
241st/ 347
METRIC RANK
81.8%
GED/EQUIVALENCY
0.0/ 100
METRIC RATING
298th/ 347
METRIC RANK
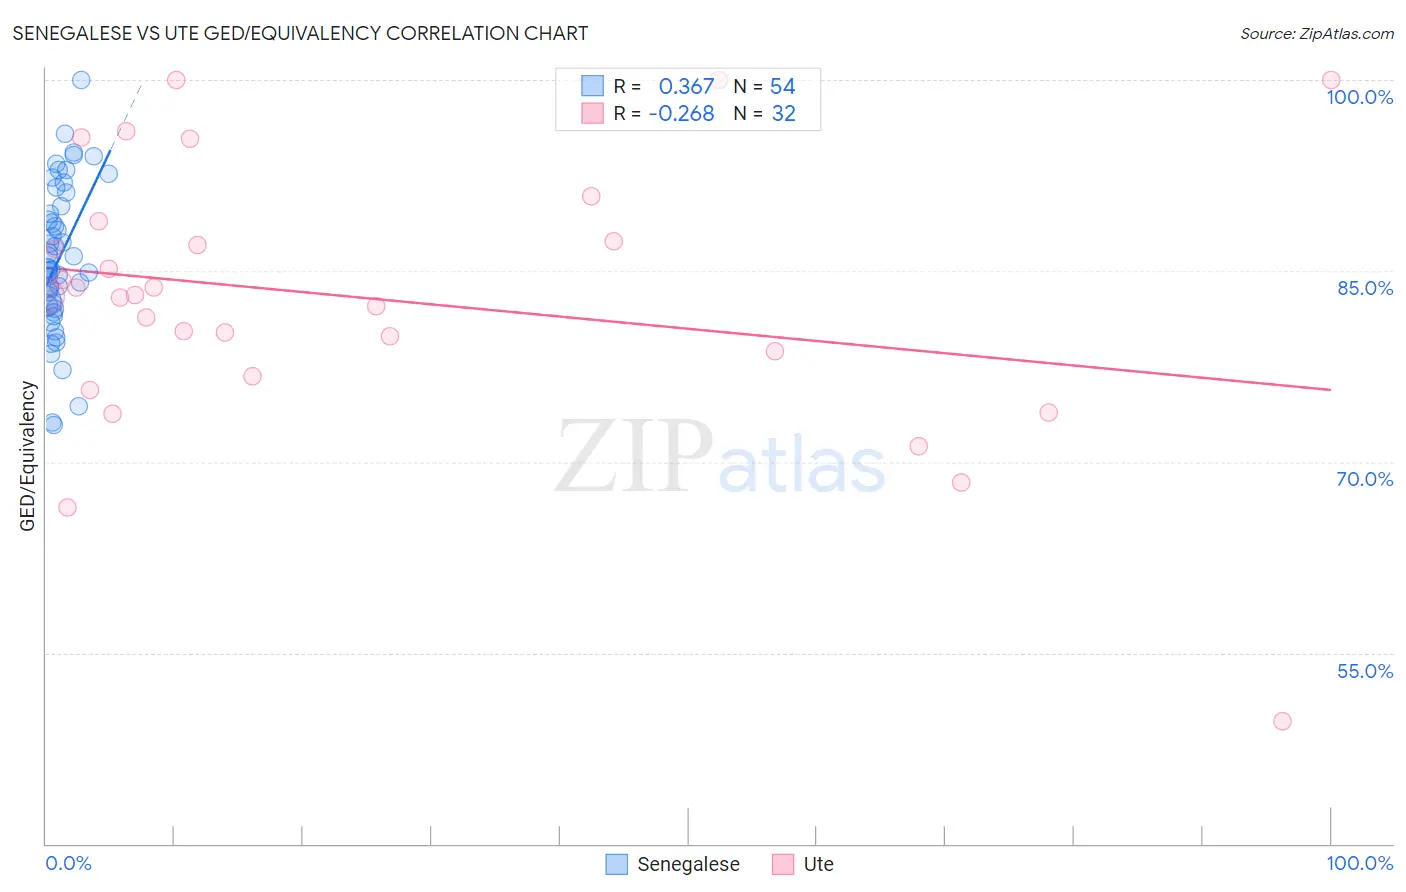
Senegalese vs Ute GED/Equivalency Correlation Chart
The statistical analysis conducted on geographies consisting of 78,142,569 people shows a mild positive correlation between the proportion of Senegalese and percentage of population with at least ged/equivalency education in the United States with a correlation coefficient (R) of 0.367 and weighted average of 84.0%. Similarly, the statistical analysis conducted on geographies consisting of 55,668,599 people shows a weak negative correlation between the proportion of Ute and percentage of population with at least ged/equivalency education in the United States with a correlation coefficient (R) of -0.268 and weighted average of 81.8%, a difference of 2.7%.
GED/Equivalency Correlation Summary
| Measurement | Senegalese | Ute |
| Minimum | 72.9% | 49.6% |
| Maximum | 100.0% | 100.0% |
| Range | 27.1% | 50.4% |
| Mean | 85.9% | 82.9% |
| Median | 85.2% | 83.0% |
| Interquartile 25% (IQ1) | 82.3% | 77.7% |
| Interquartile 75% (IQ3) | 90.0% | 88.1% |
| Interquartile Range (IQR) | 7.8% | 10.4% |
| Standard Deviation (Sample) | 5.8% | 10.7% |
| Standard Deviation (Population) | 5.8% | 10.5% |
Similar Demographics by GED/Equivalency
Demographics Similar to Senegalese by GED/Equivalency
In terms of ged/equivalency, the demographic groups most similar to Senegalese are Sri Lankan (84.0%, a difference of 0.020%), Immigrants from South Eastern Asia (84.1%, a difference of 0.14%), Immigrants from Bahamas (84.2%, a difference of 0.15%), Immigrants from Peru (84.2%, a difference of 0.18%), and Cherokee (83.9%, a difference of 0.19%).
| Demographics | Rating | Rank | GED/Equivalency |
| Immigrants | Nigeria | 3.6 /100 | #234 | Tragic 84.3% |
| Ghanaians | 3.5 /100 | #235 | Tragic 84.3% |
| Immigrants | Eritrea | 3.5 /100 | #236 | Tragic 84.3% |
| Sub-Saharan Africans | 3.0 /100 | #237 | Tragic 84.2% |
| Immigrants | Peru | 2.7 /100 | #238 | Tragic 84.2% |
| Immigrants | Bahamas | 2.6 /100 | #239 | Tragic 84.2% |
| Immigrants | South Eastern Asia | 2.5 /100 | #240 | Tragic 84.1% |
| Senegalese | 1.9 /100 | #241 | Tragic 84.0% |
| Sri Lankans | 1.9 /100 | #242 | Tragic 84.0% |
| Cherokee | 1.3 /100 | #243 | Tragic 83.9% |
| Immigrants | Ghana | 1.3 /100 | #244 | Tragic 83.9% |
| Immigrants | Senegal | 1.2 /100 | #245 | Tragic 83.8% |
| Chickasaw | 1.2 /100 | #246 | Tragic 83.8% |
| Immigrants | Western Africa | 1.1 /100 | #247 | Tragic 83.8% |
| Blackfeet | 1.1 /100 | #248 | Tragic 83.8% |
Demographics Similar to Ute by GED/Equivalency
In terms of ged/equivalency, the demographic groups most similar to Ute are Immigrants from Bangladesh (81.9%, a difference of 0.090%), Vietnamese (81.9%, a difference of 0.14%), Ecuadorian (81.7%, a difference of 0.14%), Nepalese (81.9%, a difference of 0.17%), and Fijian (81.6%, a difference of 0.20%).
| Demographics | Rating | Rank | GED/Equivalency |
| Cubans | 0.0 /100 | #291 | Tragic 82.0% |
| Paiute | 0.0 /100 | #292 | Tragic 82.0% |
| British West Indians | 0.0 /100 | #293 | Tragic 82.0% |
| Immigrants | St. Vincent and the Grenadines | 0.0 /100 | #294 | Tragic 82.0% |
| Nepalese | 0.0 /100 | #295 | Tragic 81.9% |
| Vietnamese | 0.0 /100 | #296 | Tragic 81.9% |
| Immigrants | Bangladesh | 0.0 /100 | #297 | Tragic 81.9% |
| Ute | 0.0 /100 | #298 | Tragic 81.8% |
| Ecuadorians | 0.0 /100 | #299 | Tragic 81.7% |
| Fijians | 0.0 /100 | #300 | Tragic 81.6% |
| Dutch West Indians | 0.0 /100 | #301 | Tragic 81.6% |
| Immigrants | Haiti | 0.0 /100 | #302 | Tragic 81.6% |
| Immigrants | Portugal | 0.0 /100 | #303 | Tragic 81.6% |
| Navajo | 0.0 /100 | #304 | Tragic 81.5% |
| Immigrants | Grenada | 0.0 /100 | #305 | Tragic 81.3% |