Senegalese vs Immigrants from Barbados GED/Equivalency
COMPARE
Senegalese
Immigrants from Barbados
GED/Equivalency
GED/Equivalency Comparison
Senegalese
Immigrants from Barbados
84.0%
GED/EQUIVALENCY
1.9/ 100
METRIC RATING
241st/ 347
METRIC RANK
82.4%
GED/EQUIVALENCY
0.1/ 100
METRIC RATING
284th/ 347
METRIC RANK
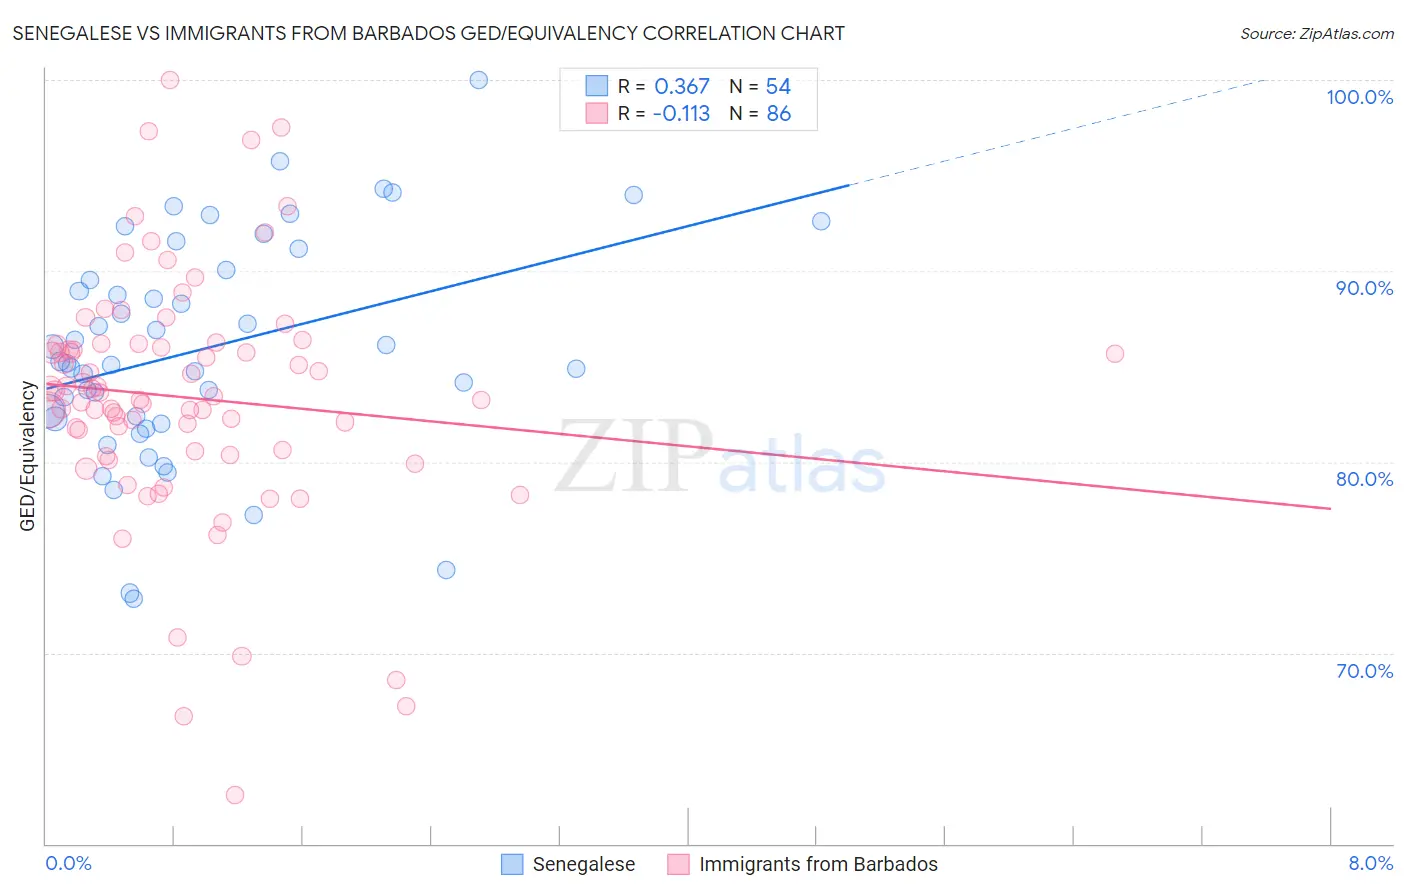
Senegalese vs Immigrants from Barbados GED/Equivalency Correlation Chart
The statistical analysis conducted on geographies consisting of 78,142,569 people shows a mild positive correlation between the proportion of Senegalese and percentage of population with at least ged/equivalency education in the United States with a correlation coefficient (R) of 0.367 and weighted average of 84.0%. Similarly, the statistical analysis conducted on geographies consisting of 112,783,324 people shows a poor negative correlation between the proportion of Immigrants from Barbados and percentage of population with at least ged/equivalency education in the United States with a correlation coefficient (R) of -0.113 and weighted average of 82.4%, a difference of 1.9%.
GED/Equivalency Correlation Summary
| Measurement | Senegalese | Immigrants from Barbados |
| Minimum | 72.9% | 62.6% |
| Maximum | 100.0% | 100.0% |
| Range | 27.1% | 37.4% |
| Mean | 85.9% | 83.4% |
| Median | 85.2% | 83.5% |
| Interquartile 25% (IQ1) | 82.3% | 80.6% |
| Interquartile 75% (IQ3) | 90.0% | 86.1% |
| Interquartile Range (IQR) | 7.8% | 5.5% |
| Standard Deviation (Sample) | 5.8% | 6.4% |
| Standard Deviation (Population) | 5.8% | 6.4% |
Similar Demographics by GED/Equivalency
Demographics Similar to Senegalese by GED/Equivalency
In terms of ged/equivalency, the demographic groups most similar to Senegalese are Sri Lankan (84.0%, a difference of 0.020%), Immigrants from South Eastern Asia (84.1%, a difference of 0.14%), Immigrants from Bahamas (84.2%, a difference of 0.15%), Immigrants from Peru (84.2%, a difference of 0.18%), and Cherokee (83.9%, a difference of 0.19%).
| Demographics | Rating | Rank | GED/Equivalency |
| Immigrants | Nigeria | 3.6 /100 | #234 | Tragic 84.3% |
| Ghanaians | 3.5 /100 | #235 | Tragic 84.3% |
| Immigrants | Eritrea | 3.5 /100 | #236 | Tragic 84.3% |
| Sub-Saharan Africans | 3.0 /100 | #237 | Tragic 84.2% |
| Immigrants | Peru | 2.7 /100 | #238 | Tragic 84.2% |
| Immigrants | Bahamas | 2.6 /100 | #239 | Tragic 84.2% |
| Immigrants | South Eastern Asia | 2.5 /100 | #240 | Tragic 84.1% |
| Senegalese | 1.9 /100 | #241 | Tragic 84.0% |
| Sri Lankans | 1.9 /100 | #242 | Tragic 84.0% |
| Cherokee | 1.3 /100 | #243 | Tragic 83.9% |
| Immigrants | Ghana | 1.3 /100 | #244 | Tragic 83.9% |
| Immigrants | Senegal | 1.2 /100 | #245 | Tragic 83.8% |
| Chickasaw | 1.2 /100 | #246 | Tragic 83.8% |
| Immigrants | Western Africa | 1.1 /100 | #247 | Tragic 83.8% |
| Blackfeet | 1.1 /100 | #248 | Tragic 83.8% |
Demographics Similar to Immigrants from Barbados by GED/Equivalency
In terms of ged/equivalency, the demographic groups most similar to Immigrants from Barbados are Cajun (82.4%, a difference of 0.030%), Immigrants from West Indies (82.4%, a difference of 0.060%), Japanese (82.4%, a difference of 0.070%), Indonesian (82.5%, a difference of 0.12%), and Immigrants (82.6%, a difference of 0.16%).
| Demographics | Rating | Rank | GED/Equivalency |
| Arapaho | 0.1 /100 | #277 | Tragic 82.8% |
| Immigrants | Laos | 0.1 /100 | #278 | Tragic 82.7% |
| Immigrants | Fiji | 0.1 /100 | #279 | Tragic 82.7% |
| Cheyenne | 0.1 /100 | #280 | Tragic 82.7% |
| Sioux | 0.1 /100 | #281 | Tragic 82.6% |
| Immigrants | Immigrants | 0.1 /100 | #282 | Tragic 82.6% |
| Indonesians | 0.1 /100 | #283 | Tragic 82.5% |
| Immigrants | Barbados | 0.1 /100 | #284 | Tragic 82.4% |
| Cajuns | 0.0 /100 | #285 | Tragic 82.4% |
| Immigrants | West Indies | 0.0 /100 | #286 | Tragic 82.4% |
| Japanese | 0.0 /100 | #287 | Tragic 82.4% |
| Pueblo | 0.0 /100 | #288 | Tragic 82.3% |
| Immigrants | Cambodia | 0.0 /100 | #289 | Tragic 82.2% |
| Haitians | 0.0 /100 | #290 | Tragic 82.1% |
| Cubans | 0.0 /100 | #291 | Tragic 82.0% |