Senegalese vs Croatian 4th Grade
COMPARE
Senegalese
Croatian
4th Grade
4th Grade Comparison
Senegalese
Croatians
97.2%
4TH GRADE
3.1/ 100
METRIC RATING
233rd/ 347
METRIC RANK
98.3%
4TH GRADE
100.0/ 100
METRIC RATING
26th/ 347
METRIC RANK
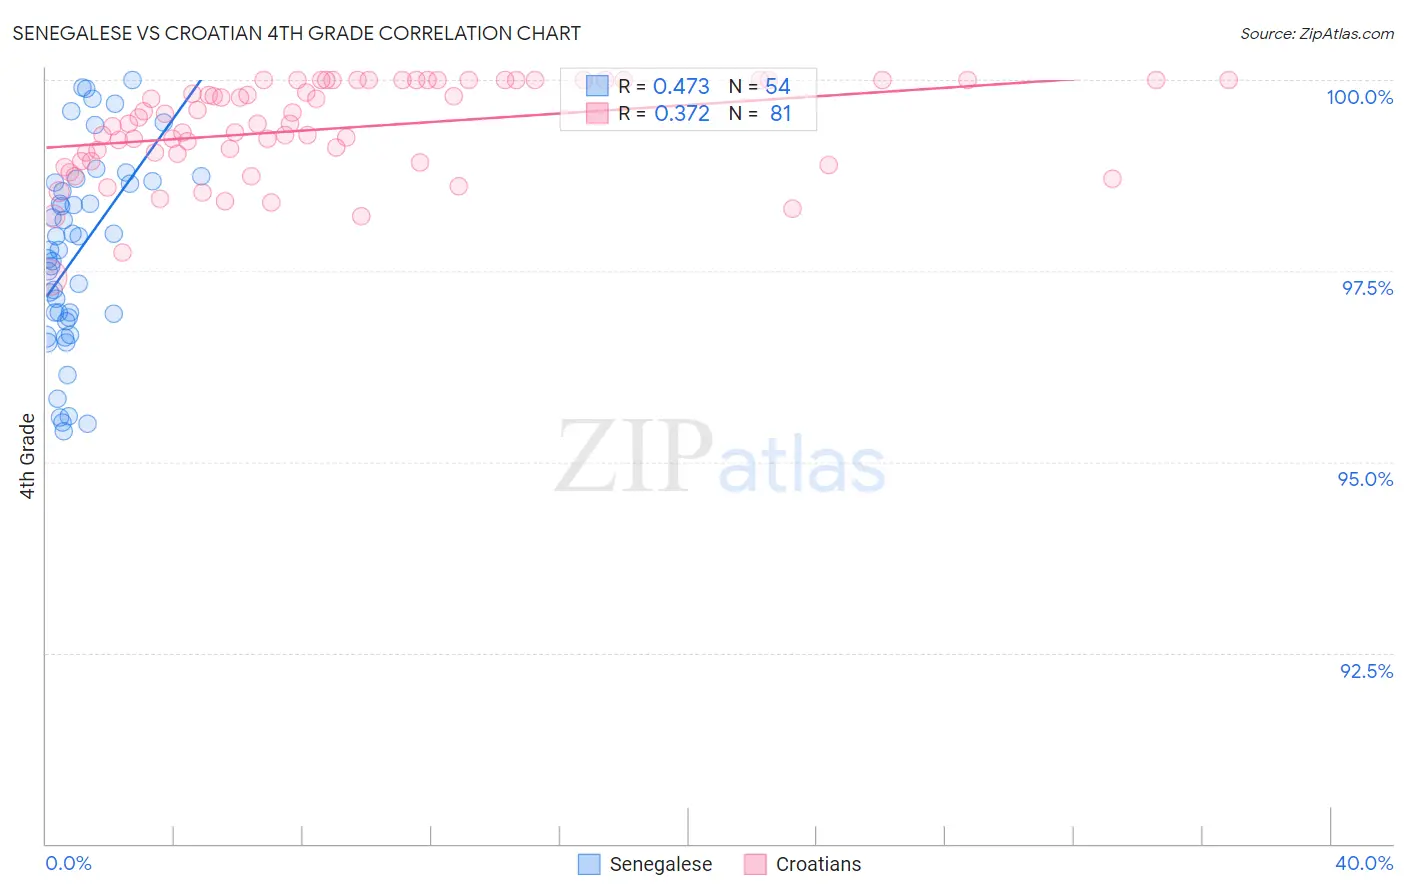
Senegalese vs Croatian 4th Grade Correlation Chart
The statistical analysis conducted on geographies consisting of 78,142,569 people shows a moderate positive correlation between the proportion of Senegalese and percentage of population with at least 4th grade education in the United States with a correlation coefficient (R) of 0.473 and weighted average of 97.2%. Similarly, the statistical analysis conducted on geographies consisting of 375,731,938 people shows a mild positive correlation between the proportion of Croatians and percentage of population with at least 4th grade education in the United States with a correlation coefficient (R) of 0.372 and weighted average of 98.3%, a difference of 1.1%.
4th Grade Correlation Summary
| Measurement | Senegalese | Croatian |
| Minimum | 95.4% | 97.4% |
| Maximum | 100.0% | 100.0% |
| Range | 4.6% | 2.6% |
| Mean | 97.7% | 99.4% |
| Median | 97.8% | 99.4% |
| Interquartile 25% (IQ1) | 96.9% | 98.9% |
| Interquartile 75% (IQ3) | 98.6% | 100.0% |
| Interquartile Range (IQR) | 1.8% | 1.1% |
| Standard Deviation (Sample) | 1.3% | 0.62% |
| Standard Deviation (Population) | 1.2% | 0.61% |
Similar Demographics by 4th Grade
Demographics Similar to Senegalese by 4th Grade
In terms of 4th grade, the demographic groups most similar to Senegalese are Assyrian/Chaldean/Syriac (97.2%, a difference of 0.0%), Subsaharan African (97.2%, a difference of 0.010%), Liberian (97.2%, a difference of 0.010%), Uruguayan (97.2%, a difference of 0.010%), and Immigrants from Malaysia (97.2%, a difference of 0.010%).
| Demographics | Rating | Rank | 4th Grade |
| Bahamians | 3.8 /100 | #226 | Tragic 97.2% |
| Immigrants | Pakistan | 3.7 /100 | #227 | Tragic 97.2% |
| Sub-Saharan Africans | 3.6 /100 | #228 | Tragic 97.2% |
| Liberians | 3.6 /100 | #229 | Tragic 97.2% |
| Uruguayans | 3.5 /100 | #230 | Tragic 97.2% |
| Immigrants | Malaysia | 3.4 /100 | #231 | Tragic 97.2% |
| Immigrants | Western Asia | 3.4 /100 | #232 | Tragic 97.2% |
| Senegalese | 3.1 /100 | #233 | Tragic 97.2% |
| Assyrians/Chaldeans/Syriacs | 3.0 /100 | #234 | Tragic 97.2% |
| Yuman | 2.9 /100 | #235 | Tragic 97.2% |
| Immigrants | Eastern Asia | 2.7 /100 | #236 | Tragic 97.2% |
| Immigrants | Costa Rica | 2.0 /100 | #237 | Tragic 97.2% |
| Indians (Asian) | 1.9 /100 | #238 | Tragic 97.2% |
| Nigerians | 1.8 /100 | #239 | Tragic 97.1% |
| Colombians | 1.6 /100 | #240 | Tragic 97.1% |
Demographics Similar to Croatians by 4th Grade
In terms of 4th grade, the demographic groups most similar to Croatians are Scotch-Irish (98.3%, a difference of 0.0%), Danish (98.3%, a difference of 0.010%), French Canadian (98.3%, a difference of 0.010%), French (98.3%, a difference of 0.010%), and Sioux (98.3%, a difference of 0.020%).
| Demographics | Rating | Rank | 4th Grade |
| Irish | 100.0 /100 | #19 | Exceptional 98.4% |
| Alaska Natives | 100.0 /100 | #20 | Exceptional 98.4% |
| Lithuanians | 100.0 /100 | #21 | Exceptional 98.3% |
| Finns | 100.0 /100 | #22 | Exceptional 98.3% |
| Sioux | 100.0 /100 | #23 | Exceptional 98.3% |
| Danes | 100.0 /100 | #24 | Exceptional 98.3% |
| Scotch-Irish | 100.0 /100 | #25 | Exceptional 98.3% |
| Croatians | 100.0 /100 | #26 | Exceptional 98.3% |
| French Canadians | 100.0 /100 | #27 | Exceptional 98.3% |
| French | 100.0 /100 | #28 | Exceptional 98.3% |
| Czechs | 100.0 /100 | #29 | Exceptional 98.3% |
| Scandinavians | 100.0 /100 | #30 | Exceptional 98.3% |
| Europeans | 100.0 /100 | #31 | Exceptional 98.3% |
| Chinese | 100.0 /100 | #32 | Exceptional 98.3% |
| Swiss | 100.0 /100 | #33 | Exceptional 98.2% |