Senegalese vs Belizean 4th Grade
COMPARE
Senegalese
Belizean
4th Grade
4th Grade Comparison
Senegalese
Belizeans
97.2%
4TH GRADE
3.1/ 100
METRIC RATING
233rd/ 347
METRIC RANK
96.1%
4TH GRADE
0.0/ 100
METRIC RATING
319th/ 347
METRIC RANK
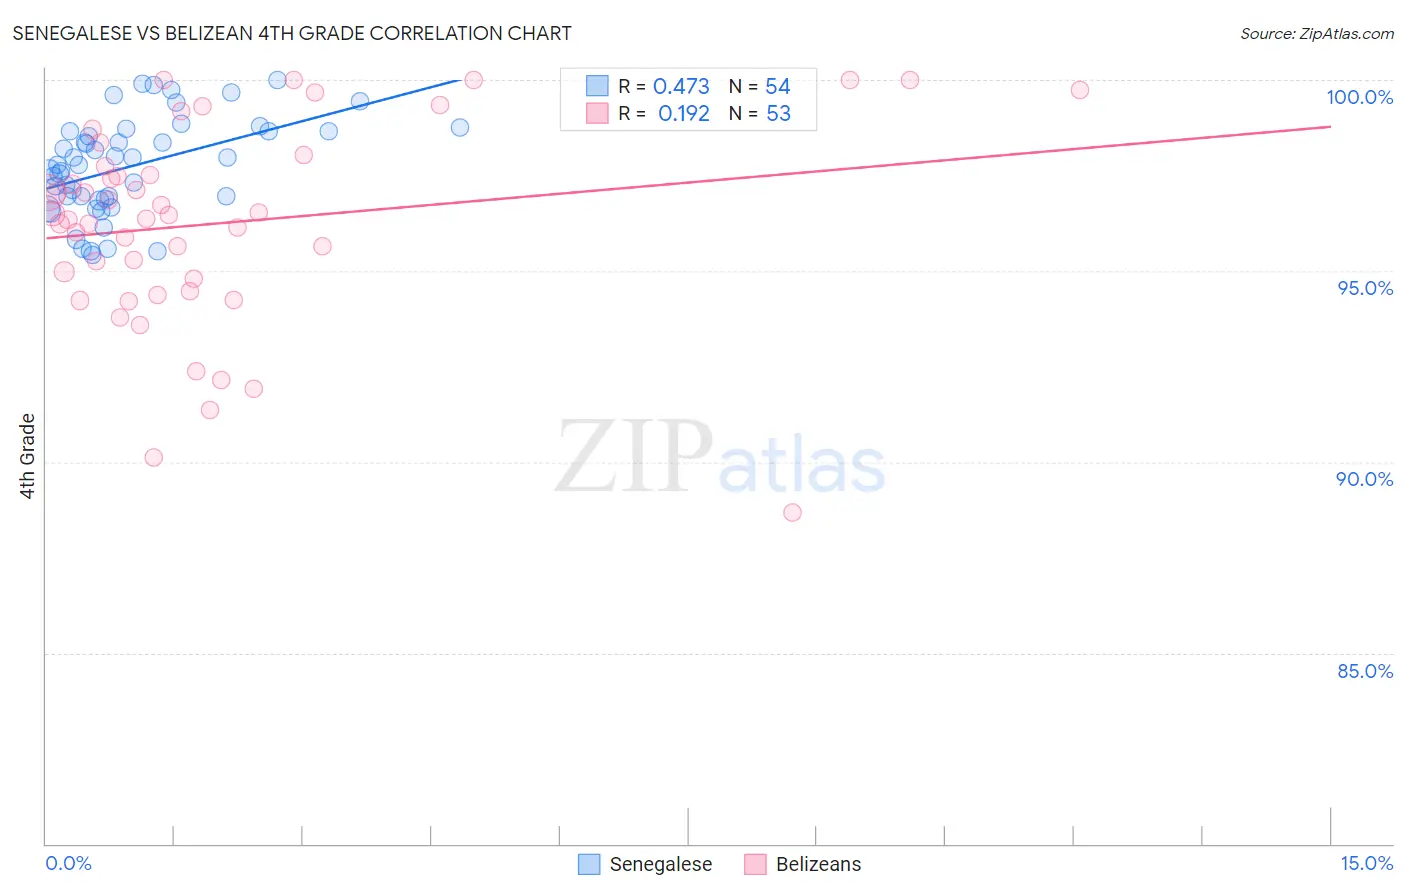
Senegalese vs Belizean 4th Grade Correlation Chart
The statistical analysis conducted on geographies consisting of 78,142,569 people shows a moderate positive correlation between the proportion of Senegalese and percentage of population with at least 4th grade education in the United States with a correlation coefficient (R) of 0.473 and weighted average of 97.2%. Similarly, the statistical analysis conducted on geographies consisting of 144,224,236 people shows a poor positive correlation between the proportion of Belizeans and percentage of population with at least 4th grade education in the United States with a correlation coefficient (R) of 0.192 and weighted average of 96.1%, a difference of 1.1%.
4th Grade Correlation Summary
| Measurement | Senegalese | Belizean |
| Minimum | 95.4% | 88.7% |
| Maximum | 100.0% | 100.0% |
| Range | 4.6% | 11.3% |
| Mean | 97.7% | 96.3% |
| Median | 97.8% | 96.5% |
| Interquartile 25% (IQ1) | 96.9% | 94.6% |
| Interquartile 75% (IQ3) | 98.6% | 97.9% |
| Interquartile Range (IQR) | 1.8% | 3.3% |
| Standard Deviation (Sample) | 1.3% | 2.6% |
| Standard Deviation (Population) | 1.2% | 2.6% |
Similar Demographics by 4th Grade
Demographics Similar to Senegalese by 4th Grade
In terms of 4th grade, the demographic groups most similar to Senegalese are Assyrian/Chaldean/Syriac (97.2%, a difference of 0.0%), Subsaharan African (97.2%, a difference of 0.010%), Liberian (97.2%, a difference of 0.010%), Uruguayan (97.2%, a difference of 0.010%), and Immigrants from Malaysia (97.2%, a difference of 0.010%).
| Demographics | Rating | Rank | 4th Grade |
| Bahamians | 3.8 /100 | #226 | Tragic 97.2% |
| Immigrants | Pakistan | 3.7 /100 | #227 | Tragic 97.2% |
| Sub-Saharan Africans | 3.6 /100 | #228 | Tragic 97.2% |
| Liberians | 3.6 /100 | #229 | Tragic 97.2% |
| Uruguayans | 3.5 /100 | #230 | Tragic 97.2% |
| Immigrants | Malaysia | 3.4 /100 | #231 | Tragic 97.2% |
| Immigrants | Western Asia | 3.4 /100 | #232 | Tragic 97.2% |
| Senegalese | 3.1 /100 | #233 | Tragic 97.2% |
| Assyrians/Chaldeans/Syriacs | 3.0 /100 | #234 | Tragic 97.2% |
| Yuman | 2.9 /100 | #235 | Tragic 97.2% |
| Immigrants | Eastern Asia | 2.7 /100 | #236 | Tragic 97.2% |
| Immigrants | Costa Rica | 2.0 /100 | #237 | Tragic 97.2% |
| Indians (Asian) | 1.9 /100 | #238 | Tragic 97.2% |
| Nigerians | 1.8 /100 | #239 | Tragic 97.1% |
| Colombians | 1.6 /100 | #240 | Tragic 97.1% |
Demographics Similar to Belizeans by 4th Grade
In terms of 4th grade, the demographic groups most similar to Belizeans are Bangladeshi (96.1%, a difference of 0.010%), Immigrants from the Azores (96.1%, a difference of 0.020%), Central American Indian (96.2%, a difference of 0.060%), Immigrants from Ecuador (96.2%, a difference of 0.10%), and Japanese (96.0%, a difference of 0.10%).
| Demographics | Rating | Rank | 4th Grade |
| Cape Verdeans | 0.0 /100 | #312 | Tragic 96.2% |
| Indonesians | 0.0 /100 | #313 | Tragic 96.2% |
| Vietnamese | 0.0 /100 | #314 | Tragic 96.2% |
| Nicaraguans | 0.0 /100 | #315 | Tragic 96.2% |
| Immigrants | Ecuador | 0.0 /100 | #316 | Tragic 96.2% |
| Central American Indians | 0.0 /100 | #317 | Tragic 96.2% |
| Immigrants | Azores | 0.0 /100 | #318 | Tragic 96.1% |
| Belizeans | 0.0 /100 | #319 | Tragic 96.1% |
| Bangladeshis | 0.0 /100 | #320 | Tragic 96.1% |
| Japanese | 0.0 /100 | #321 | Tragic 96.0% |
| Immigrants | Vietnam | 0.0 /100 | #322 | Tragic 96.0% |
| Immigrants | Nicaragua | 0.0 /100 | #323 | Tragic 96.0% |
| Immigrants | Belize | 0.0 /100 | #324 | Tragic 96.0% |
| Dominicans | 0.0 /100 | #325 | Tragic 96.0% |
| Hispanics or Latinos | 0.0 /100 | #326 | Tragic 96.0% |