Palestinian vs Immigrants from Europe Associate's Degree
COMPARE
Palestinian
Immigrants from Europe
Associate's Degree
Associate's Degree Comparison
Palestinians
Immigrants from Europe
49.0%
ASSOCIATE'S DEGREE
95.3/ 100
METRIC RATING
113th/ 347
METRIC RANK
51.3%
ASSOCIATE'S DEGREE
99.7/ 100
METRIC RATING
66th/ 347
METRIC RANK
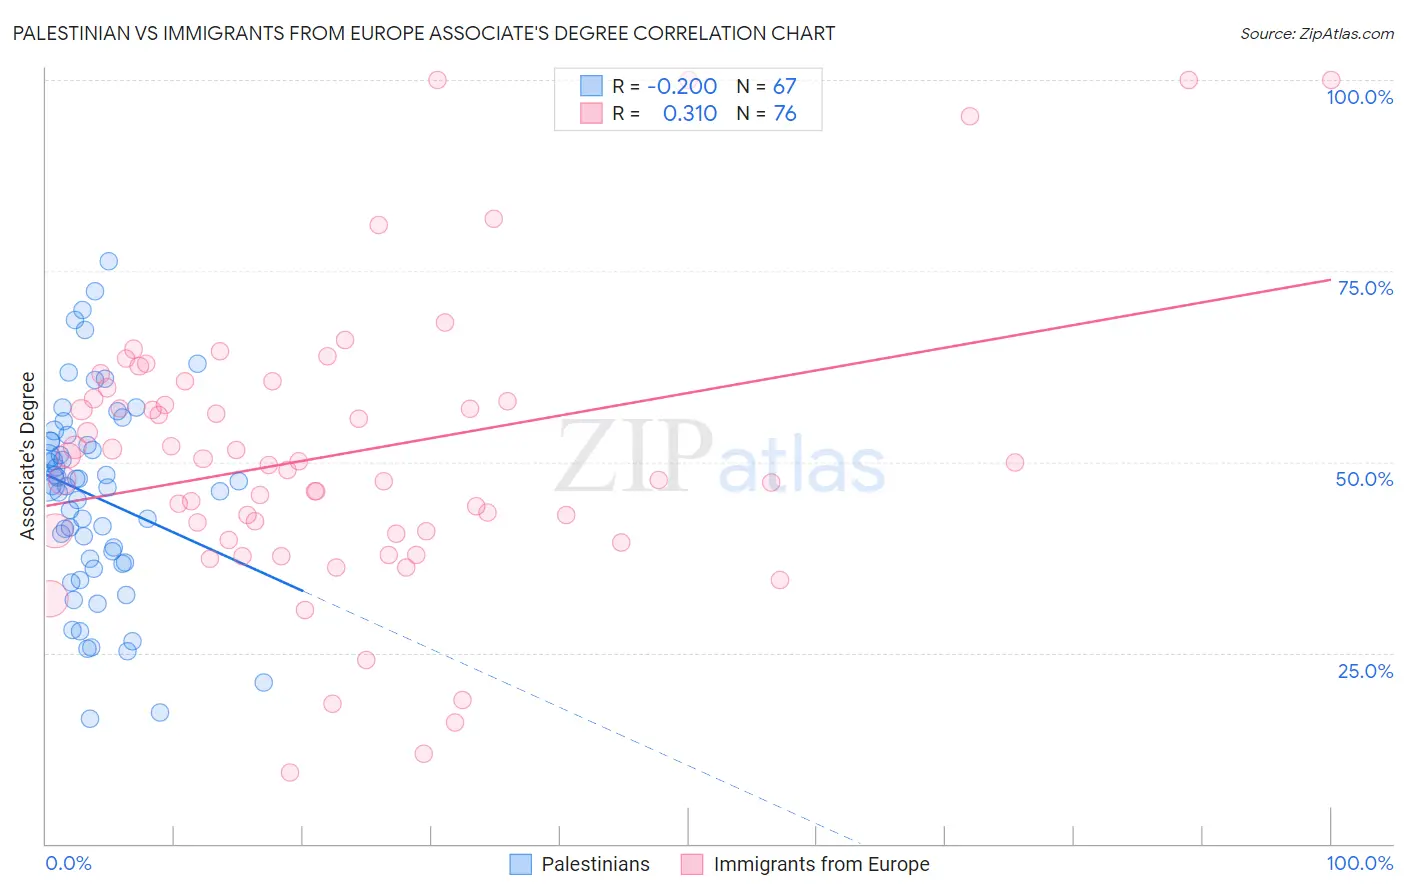
Palestinian vs Immigrants from Europe Associate's Degree Correlation Chart
The statistical analysis conducted on geographies consisting of 216,454,143 people shows a weak negative correlation between the proportion of Palestinians and percentage of population with at least associate's degree education in the United States with a correlation coefficient (R) of -0.200 and weighted average of 49.0%. Similarly, the statistical analysis conducted on geographies consisting of 547,360,790 people shows a mild positive correlation between the proportion of Immigrants from Europe and percentage of population with at least associate's degree education in the United States with a correlation coefficient (R) of 0.310 and weighted average of 51.3%, a difference of 4.8%.
Associate's Degree Correlation Summary
| Measurement | Palestinian | Immigrants from Europe |
| Minimum | 16.3% | 9.3% |
| Maximum | 76.3% | 100.0% |
| Range | 60.0% | 90.7% |
| Mean | 45.5% | 51.1% |
| Median | 46.9% | 49.8% |
| Interquartile 25% (IQ1) | 36.9% | 40.8% |
| Interquartile 75% (IQ3) | 52.6% | 59.0% |
| Interquartile Range (IQR) | 15.7% | 18.2% |
| Standard Deviation (Sample) | 13.0% | 18.8% |
| Standard Deviation (Population) | 12.9% | 18.7% |
Similar Demographics by Associate's Degree
Demographics Similar to Palestinians by Associate's Degree
In terms of associate's degree, the demographic groups most similar to Palestinians are Immigrants from Chile (49.0%, a difference of 0.0%), Arab (49.0%, a difference of 0.0%), Luxembourger (48.9%, a difference of 0.070%), British (48.9%, a difference of 0.13%), and Afghan (48.9%, a difference of 0.18%).
| Demographics | Rating | Rank | Associate's Degree |
| Immigrants | Italy | 96.7 /100 | #106 | Exceptional 49.3% |
| Syrians | 96.7 /100 | #107 | Exceptional 49.3% |
| Jordanians | 96.6 /100 | #108 | Exceptional 49.2% |
| Immigrants | Morocco | 96.3 /100 | #109 | Exceptional 49.2% |
| Austrians | 95.8 /100 | #110 | Exceptional 49.1% |
| Immigrants | Venezuela | 95.8 /100 | #111 | Exceptional 49.1% |
| Immigrants | Chile | 95.3 /100 | #112 | Exceptional 49.0% |
| Palestinians | 95.3 /100 | #113 | Exceptional 49.0% |
| Arabs | 95.3 /100 | #114 | Exceptional 49.0% |
| Luxembourgers | 95.1 /100 | #115 | Exceptional 48.9% |
| British | 95.0 /100 | #116 | Exceptional 48.9% |
| Afghans | 94.8 /100 | #117 | Exceptional 48.9% |
| Albanians | 94.7 /100 | #118 | Exceptional 48.8% |
| Lebanese | 94.6 /100 | #119 | Exceptional 48.8% |
| Alsatians | 94.6 /100 | #120 | Exceptional 48.8% |
Demographics Similar to Immigrants from Europe by Associate's Degree
In terms of associate's degree, the demographic groups most similar to Immigrants from Europe are Zimbabwean (51.3%, a difference of 0.050%), Immigrants from Netherlands (51.4%, a difference of 0.080%), Argentinean (51.2%, a difference of 0.13%), South African (51.4%, a difference of 0.16%), and Immigrants from Kazakhstan (51.4%, a difference of 0.21%).
| Demographics | Rating | Rank | Associate's Degree |
| Immigrants | Serbia | 99.8 /100 | #59 | Exceptional 51.7% |
| Immigrants | Bolivia | 99.7 /100 | #60 | Exceptional 51.5% |
| Immigrants | Kazakhstan | 99.7 /100 | #61 | Exceptional 51.4% |
| Bhutanese | 99.7 /100 | #62 | Exceptional 51.4% |
| South Africans | 99.7 /100 | #63 | Exceptional 51.4% |
| Immigrants | Netherlands | 99.7 /100 | #64 | Exceptional 51.4% |
| Zimbabweans | 99.7 /100 | #65 | Exceptional 51.3% |
| Immigrants | Europe | 99.7 /100 | #66 | Exceptional 51.3% |
| Argentineans | 99.6 /100 | #67 | Exceptional 51.2% |
| Immigrants | Indonesia | 99.5 /100 | #68 | Exceptional 51.0% |
| Egyptians | 99.5 /100 | #69 | Exceptional 50.9% |
| Immigrants | Argentina | 99.5 /100 | #70 | Exceptional 50.9% |
| Immigrants | Romania | 99.5 /100 | #71 | Exceptional 50.9% |
| Immigrants | Pakistan | 99.5 /100 | #72 | Exceptional 50.9% |
| Carpatho Rusyns | 99.3 /100 | #73 | Exceptional 50.6% |