Immigrants from Croatia vs Immigrants from Europe Associate's Degree
COMPARE
Immigrants from Croatia
Immigrants from Europe
Associate's Degree
Associate's Degree Comparison
Immigrants from Croatia
Immigrants from Europe
50.2%
ASSOCIATE'S DEGREE
98.9/ 100
METRIC RATING
86th/ 347
METRIC RANK
51.3%
ASSOCIATE'S DEGREE
99.7/ 100
METRIC RATING
66th/ 347
METRIC RANK
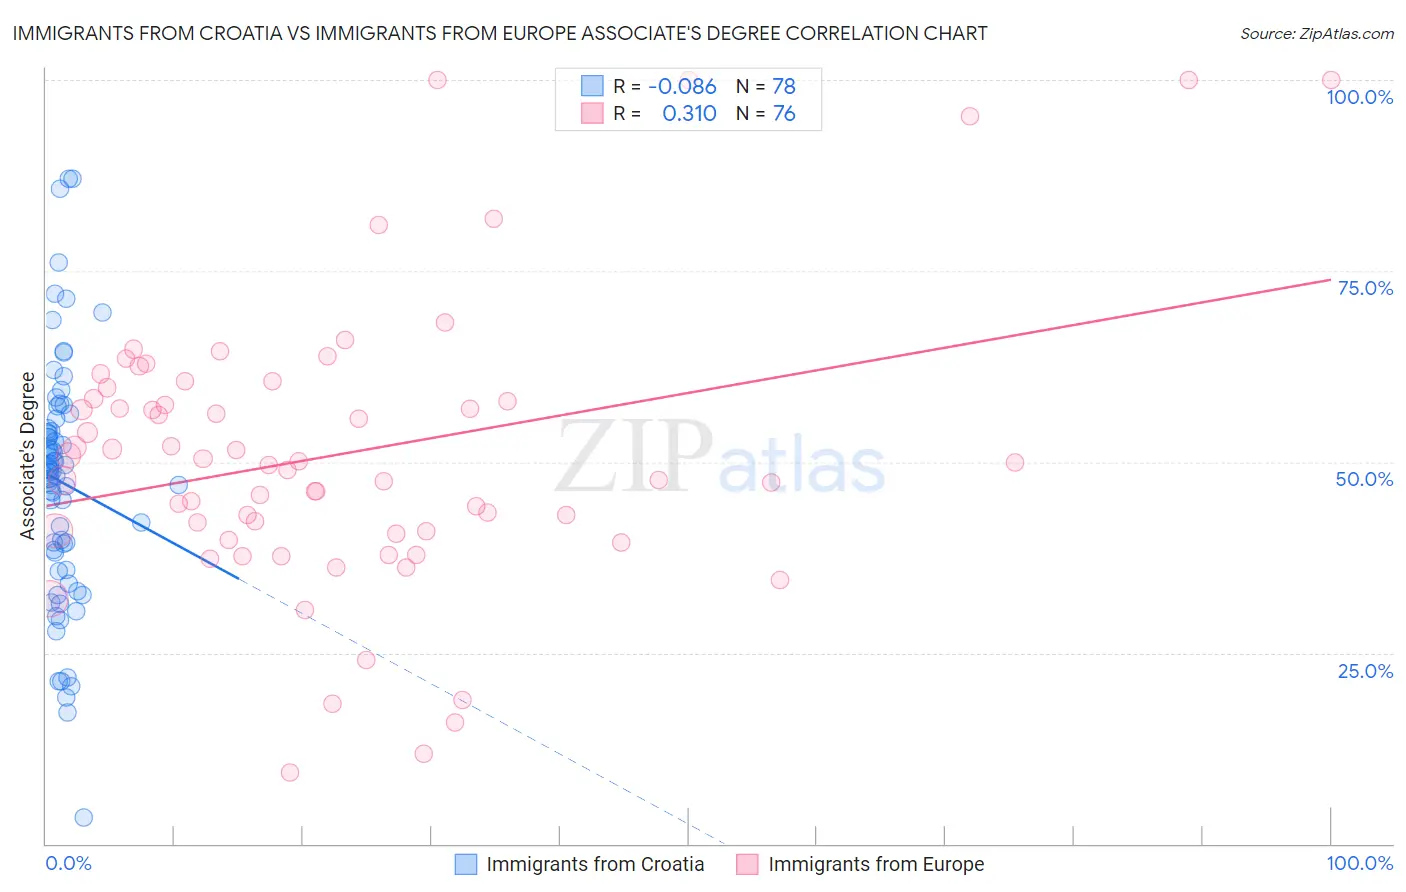
Immigrants from Croatia vs Immigrants from Europe Associate's Degree Correlation Chart
The statistical analysis conducted on geographies consisting of 132,578,161 people shows a slight negative correlation between the proportion of Immigrants from Croatia and percentage of population with at least associate's degree education in the United States with a correlation coefficient (R) of -0.086 and weighted average of 50.2%. Similarly, the statistical analysis conducted on geographies consisting of 547,360,790 people shows a mild positive correlation between the proportion of Immigrants from Europe and percentage of population with at least associate's degree education in the United States with a correlation coefficient (R) of 0.310 and weighted average of 51.3%, a difference of 2.2%.
Associate's Degree Correlation Summary
| Measurement | Immigrants from Croatia | Immigrants from Europe |
| Minimum | 3.4% | 9.3% |
| Maximum | 87.1% | 100.0% |
| Range | 83.7% | 90.7% |
| Mean | 47.3% | 51.1% |
| Median | 48.7% | 49.8% |
| Interquartile 25% (IQ1) | 38.1% | 40.8% |
| Interquartile 75% (IQ3) | 54.3% | 59.0% |
| Interquartile Range (IQR) | 16.2% | 18.2% |
| Standard Deviation (Sample) | 15.9% | 18.8% |
| Standard Deviation (Population) | 15.8% | 18.7% |
Demographics Similar to Immigrants from Croatia and Immigrants from Europe by Associate's Degree
In terms of associate's degree, the demographic groups most similar to Immigrants from Croatia are Immigrants from Egypt (50.2%, a difference of 0.010%), Immigrants from Hungary (50.2%, a difference of 0.060%), Immigrants from Uzbekistan (50.3%, a difference of 0.080%), Greek (50.3%, a difference of 0.12%), and Maltese (50.4%, a difference of 0.35%). Similarly, the demographic groups most similar to Immigrants from Europe are Argentinean (51.2%, a difference of 0.13%), Immigrants from Indonesia (51.0%, a difference of 0.62%), Egyptian (50.9%, a difference of 0.75%), Immigrants from Argentina (50.9%, a difference of 0.78%), and Immigrants from Romania (50.9%, a difference of 0.79%).
| Demographics | Rating | Rank | Associate's Degree |
| Immigrants | Europe | 99.7 /100 | #66 | Exceptional 51.3% |
| Argentineans | 99.6 /100 | #67 | Exceptional 51.2% |
| Immigrants | Indonesia | 99.5 /100 | #68 | Exceptional 51.0% |
| Egyptians | 99.5 /100 | #69 | Exceptional 50.9% |
| Immigrants | Argentina | 99.5 /100 | #70 | Exceptional 50.9% |
| Immigrants | Romania | 99.5 /100 | #71 | Exceptional 50.9% |
| Immigrants | Pakistan | 99.5 /100 | #72 | Exceptional 50.9% |
| Carpatho Rusyns | 99.3 /100 | #73 | Exceptional 50.6% |
| Lithuanians | 99.3 /100 | #74 | Exceptional 50.6% |
| Immigrants | Scotland | 99.3 /100 | #75 | Exceptional 50.6% |
| Immigrants | Zimbabwe | 99.2 /100 | #76 | Exceptional 50.5% |
| Immigrants | Lebanon | 99.1 /100 | #77 | Exceptional 50.5% |
| Immigrants | Eastern Europe | 99.1 /100 | #78 | Exceptional 50.5% |
| Ethiopians | 99.1 /100 | #79 | Exceptional 50.4% |
| Armenians | 99.1 /100 | #80 | Exceptional 50.4% |
| Maltese | 99.1 /100 | #81 | Exceptional 50.4% |
| Greeks | 98.9 /100 | #82 | Exceptional 50.3% |
| Immigrants | Uzbekistan | 98.9 /100 | #83 | Exceptional 50.3% |
| Immigrants | Hungary | 98.9 /100 | #84 | Exceptional 50.2% |
| Immigrants | Egypt | 98.9 /100 | #85 | Exceptional 50.2% |
| Immigrants | Croatia | 98.9 /100 | #86 | Exceptional 50.2% |