Filipino vs Immigrants from Caribbean Bachelor's Degree
COMPARE
Filipino
Immigrants from Caribbean
Bachelor's Degree
Bachelor's Degree Comparison
Filipinos
Immigrants from Caribbean
52.7%
BACHELOR'S DEGREE
100.0/ 100
METRIC RATING
1st/ 347
METRIC RANK
31.4%
BACHELOR'S DEGREE
0.1/ 100
METRIC RATING
282nd/ 347
METRIC RANK
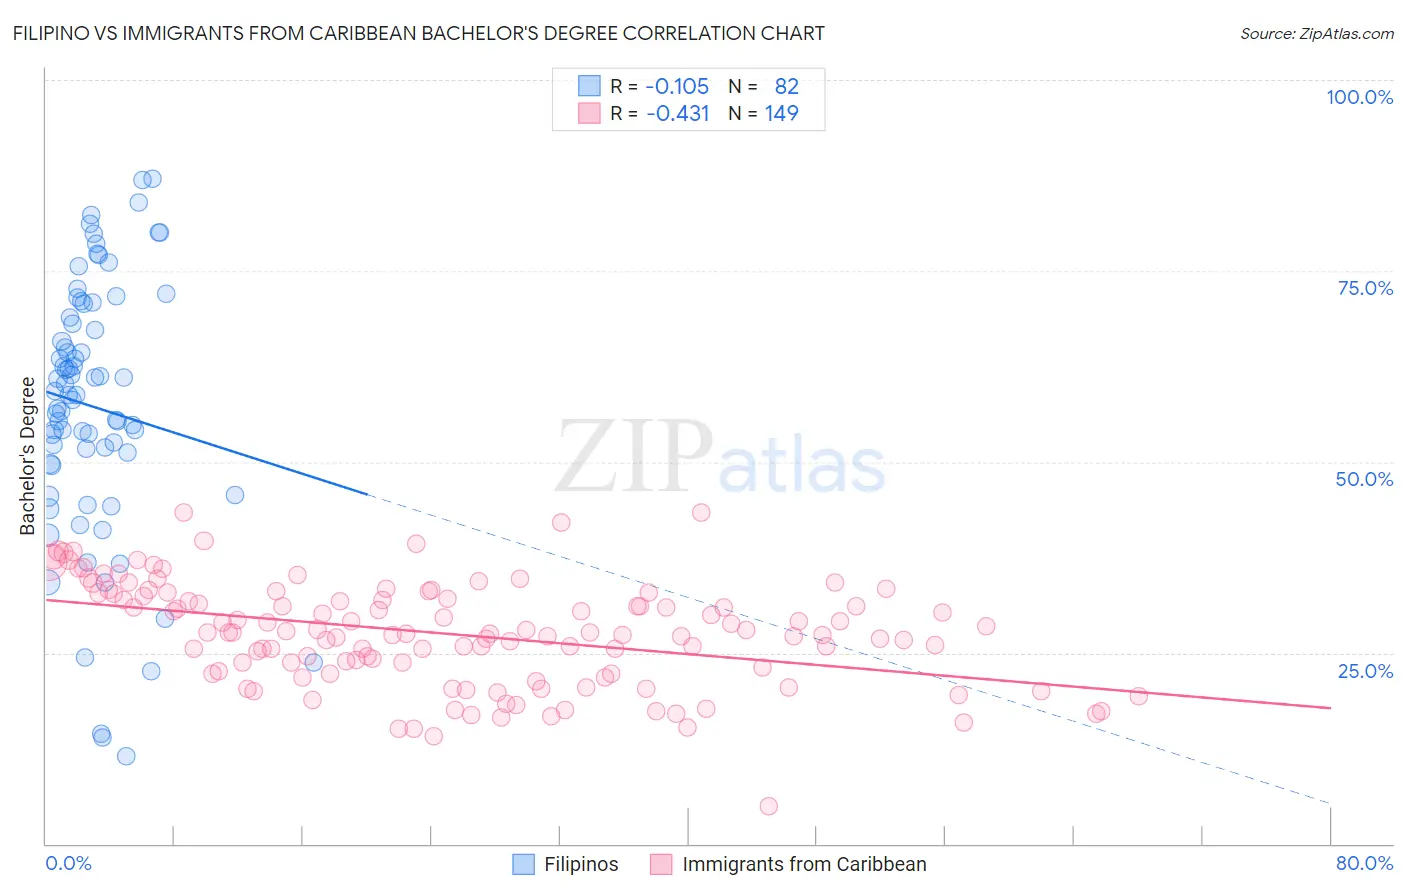
Filipino vs Immigrants from Caribbean Bachelor's Degree Correlation Chart
The statistical analysis conducted on geographies consisting of 254,333,448 people shows a poor negative correlation between the proportion of Filipinos and percentage of population with at least bachelor's degree education in the United States with a correlation coefficient (R) of -0.105 and weighted average of 52.7%. Similarly, the statistical analysis conducted on geographies consisting of 450,021,690 people shows a moderate negative correlation between the proportion of Immigrants from Caribbean and percentage of population with at least bachelor's degree education in the United States with a correlation coefficient (R) of -0.431 and weighted average of 31.4%, a difference of 67.8%.
Bachelor's Degree Correlation Summary
| Measurement | Filipino | Immigrants from Caribbean |
| Minimum | 11.5% | 4.9% |
| Maximum | 87.0% | 43.4% |
| Range | 75.5% | 38.5% |
| Mean | 57.2% | 27.5% |
| Median | 58.7% | 27.6% |
| Interquartile 25% (IQ1) | 49.7% | 22.5% |
| Interquartile 75% (IQ3) | 68.9% | 32.6% |
| Interquartile Range (IQR) | 19.1% | 10.1% |
| Standard Deviation (Sample) | 16.9% | 6.8% |
| Standard Deviation (Population) | 16.8% | 6.8% |
Similar Demographics by Bachelor's Degree
Demographics Similar to Filipinos by Bachelor's Degree
In terms of bachelor's degree, the demographic groups most similar to Filipinos are Immigrants from Singapore (51.9%, a difference of 1.5%), Immigrants from India (51.3%, a difference of 2.8%), Immigrants from Taiwan (51.2%, a difference of 3.0%), Iranian (51.0%, a difference of 3.4%), and Okinawan (50.5%, a difference of 4.3%).
| Demographics | Rating | Rank | Bachelor's Degree |
| Filipinos | 100.0 /100 | #1 | Exceptional 52.7% |
| Immigrants | Singapore | 100.0 /100 | #2 | Exceptional 51.9% |
| Immigrants | India | 100.0 /100 | #3 | Exceptional 51.3% |
| Immigrants | Taiwan | 100.0 /100 | #4 | Exceptional 51.2% |
| Iranians | 100.0 /100 | #5 | Exceptional 51.0% |
| Okinawans | 100.0 /100 | #6 | Exceptional 50.5% |
| Immigrants | Iran | 100.0 /100 | #7 | Exceptional 50.3% |
| Thais | 100.0 /100 | #8 | Exceptional 50.1% |
| Immigrants | Israel | 100.0 /100 | #9 | Exceptional 50.0% |
| Cypriots | 100.0 /100 | #10 | Exceptional 49.0% |
| Immigrants | Australia | 100.0 /100 | #11 | Exceptional 48.5% |
| Immigrants | China | 100.0 /100 | #12 | Exceptional 48.4% |
| Immigrants | South Central Asia | 100.0 /100 | #13 | Exceptional 48.3% |
| Immigrants | Hong Kong | 100.0 /100 | #14 | Exceptional 48.2% |
| Immigrants | Eastern Asia | 100.0 /100 | #15 | Exceptional 48.1% |
Demographics Similar to Immigrants from Caribbean by Bachelor's Degree
In terms of bachelor's degree, the demographic groups most similar to Immigrants from Caribbean are Blackfeet (31.5%, a difference of 0.15%), Honduran (31.3%, a difference of 0.28%), Haitian (31.3%, a difference of 0.31%), Aleut (31.3%, a difference of 0.32%), and Immigrants from El Salvador (31.3%, a difference of 0.38%).
| Demographics | Rating | Rank | Bachelor's Degree |
| Samoans | 0.1 /100 | #275 | Tragic 31.8% |
| Salvadorans | 0.1 /100 | #276 | Tragic 31.8% |
| Dominicans | 0.1 /100 | #277 | Tragic 31.8% |
| Marshallese | 0.1 /100 | #278 | Tragic 31.7% |
| Hawaiians | 0.1 /100 | #279 | Tragic 31.6% |
| Immigrants | Laos | 0.1 /100 | #280 | Tragic 31.6% |
| Blackfeet | 0.1 /100 | #281 | Tragic 31.5% |
| Immigrants | Caribbean | 0.1 /100 | #282 | Tragic 31.4% |
| Hondurans | 0.1 /100 | #283 | Tragic 31.3% |
| Haitians | 0.1 /100 | #284 | Tragic 31.3% |
| Aleuts | 0.1 /100 | #285 | Tragic 31.3% |
| Immigrants | El Salvador | 0.1 /100 | #286 | Tragic 31.3% |
| Ottawa | 0.1 /100 | #287 | Tragic 31.1% |
| Guatemalans | 0.1 /100 | #288 | Tragic 31.0% |
| Puerto Ricans | 0.1 /100 | #289 | Tragic 31.0% |